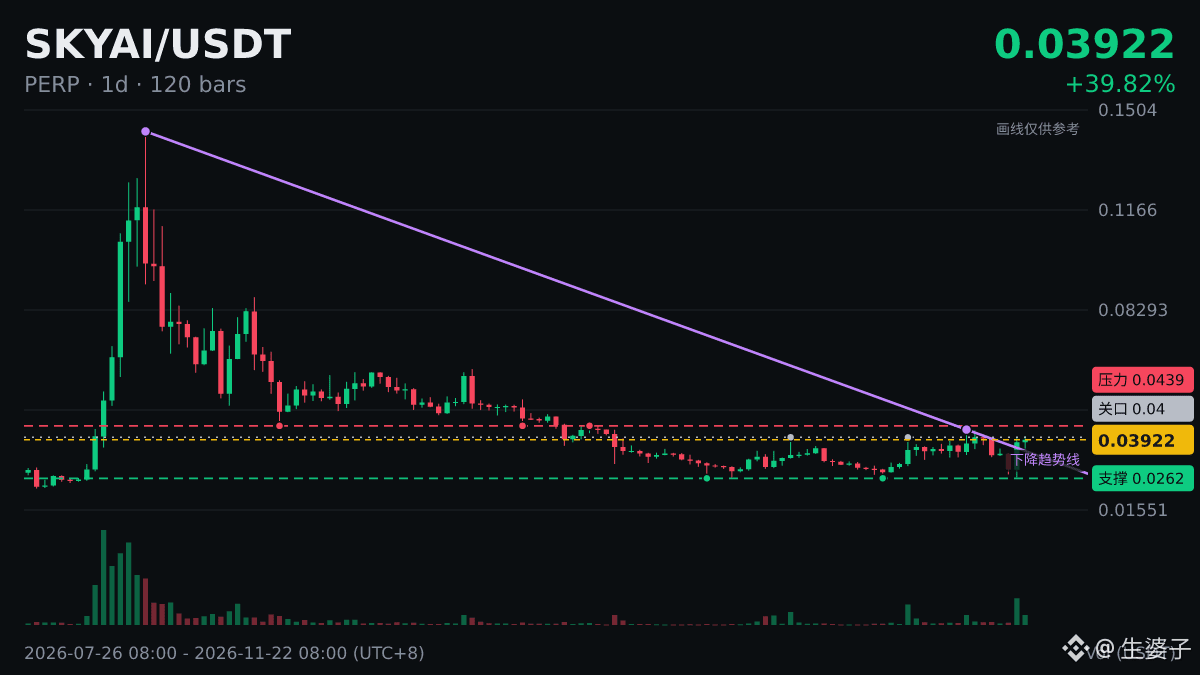
$SKYAI The daily chart has moved above MA50 (0.03346).
A newbie’s soul-searching question: What is a moving average?
On a daily chart, MA200 is the average closing price over the most recent 200 days and is often seen as a reference for bull or bear market direction; MA50 is commonly used to gauge the medium-term trend.
Moving averages are famously lagging—about as fast as I am at replying to messages.
Don’t place an order at the most volatile moment; wait for the price to stabilize before deciding.
A newbie’s soul-searching question: What is a moving average?
On a daily chart, MA200 is the average closing price over the most recent 200 days and is often seen as a reference for bull or bear market direction; MA50 is commonly used to gauge the medium-term trend.
Moving averages are famously lagging—about as fast as I am at replying to messages.
Don’t place an order at the most volatile moment; wait for the price to stabilize before deciding.