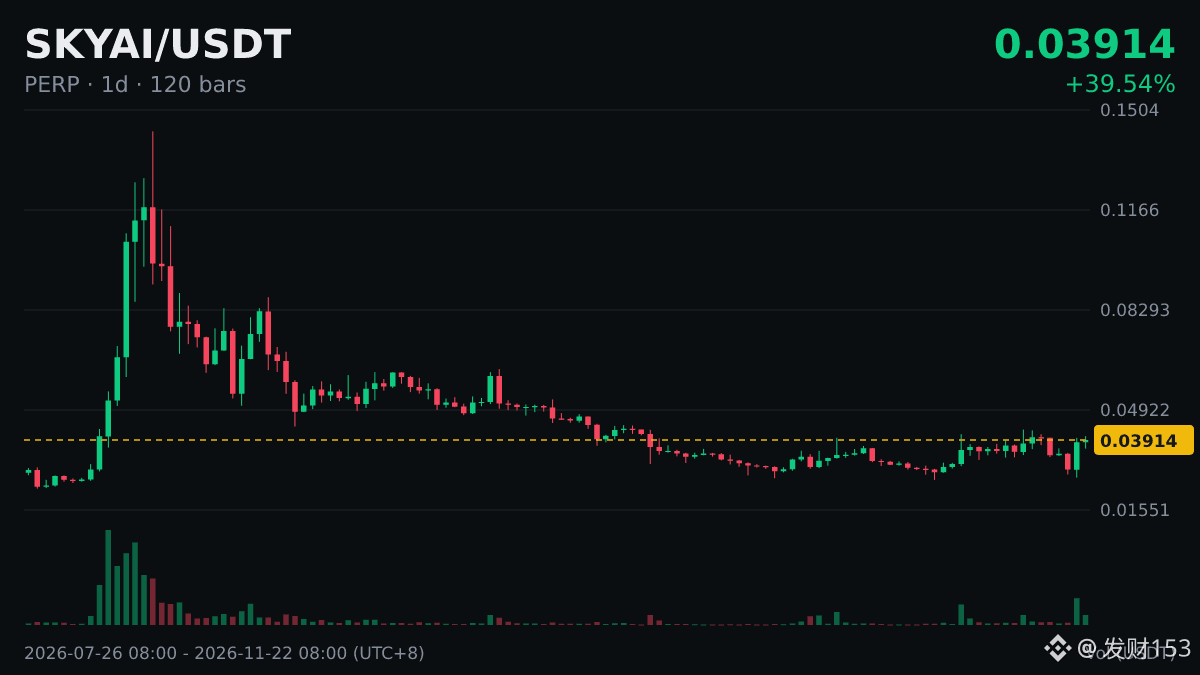
🔢 Data: $SKYAI |Daily price above MA50|MA50 0.03346
· Definition: Long-term moving averages such as MA200 are widely watched, partly because so many people are watching them. When the price approaches these lines, volatility often becomes more pronounced.
· How to read it: Many people wait to see whether the price pulls back after moving above the line without falling back below it before treating the breakout as genuine. After a break below, they look for a rebound that fails to move back above the line as confirmation.
Multiple indicators confirming one another is more reliable than looking at just one, but even more signals still can’t provide a definitive conclusion.
#SKYAI
· Definition: Long-term moving averages such as MA200 are widely watched, partly because so many people are watching them. When the price approaches these lines, volatility often becomes more pronounced.
· How to read it: Many people wait to see whether the price pulls back after moving above the line without falling back below it before treating the breakout as genuine. After a break below, they look for a rebound that fails to move back above the line as confirmation.
Multiple indicators confirming one another is more reliable than looking at just one, but even more signals still can’t provide a definitive conclusion.
#SKYAI