$BARD: The Value of Slow Analysis in an Era of Instant Hot Takes
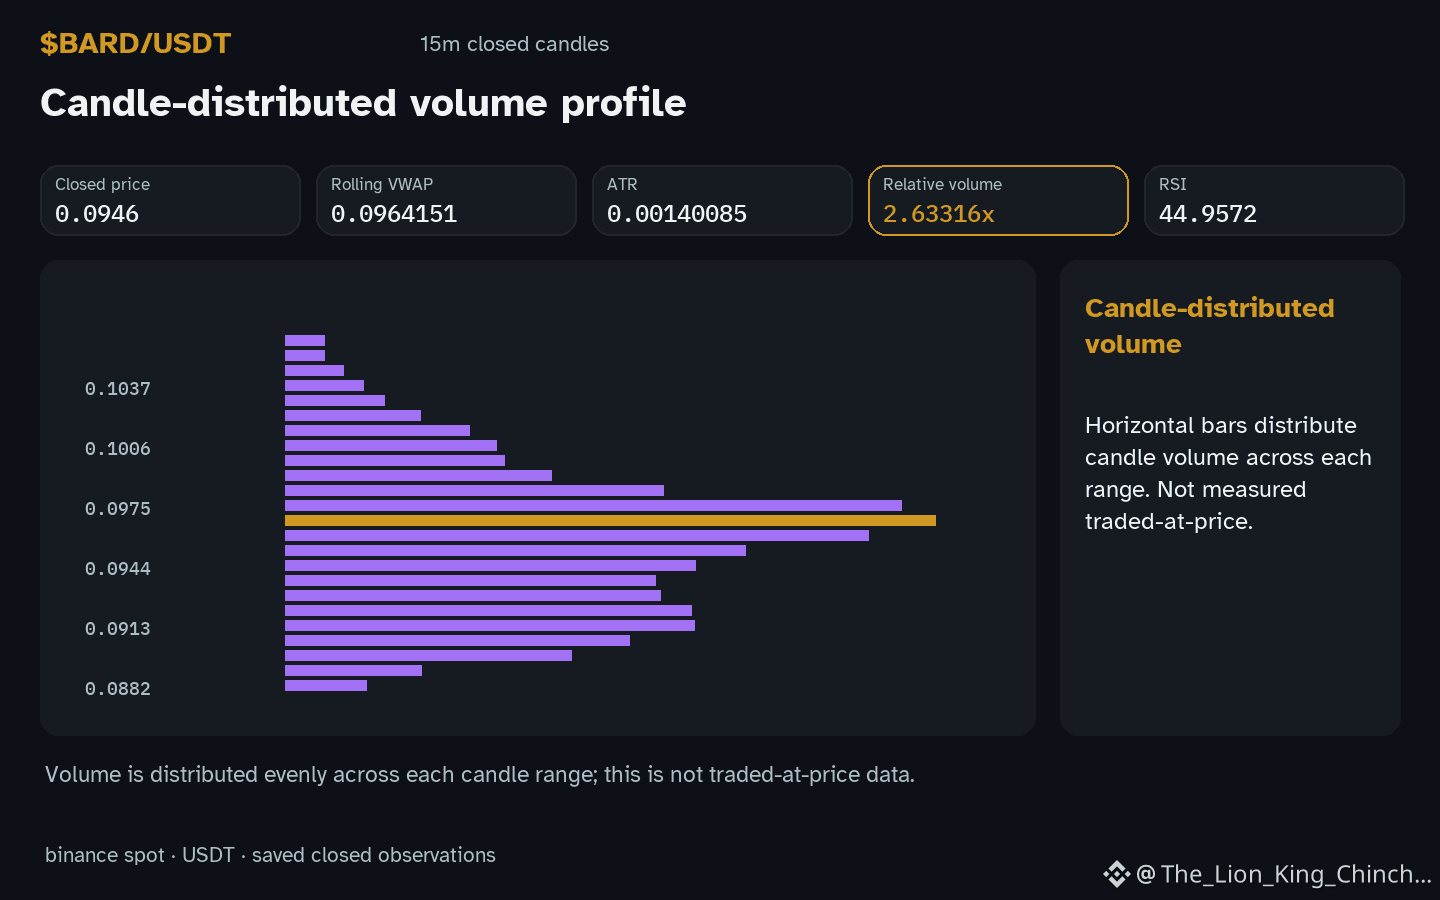
$BARD: BARD prints hourly gains while relative volume sits at 2.63x baseline. The observation raises a simple question: does a quick read of volume and price produce a useful pause or a rushed conclusion?
A common assumption
Traders often treat an above-baseline volume print alongside an up hourly candle as a green light to enter immediately. The logic feels intuitive: more activity plus higher price must mean conviction. Yet the saved record only shows that volume exceeded its recent average while price moved up inside the recorded range between 0.0933 and 0.0994. No order-flow data, motive, or causation is captured. RSI reads 45.0, and MACD sits at -0.000614565 versus signal -0.000532038. These are static readings from one closed candle, not forecasts.
The counterexample to consider
Imagine a participant who waits for the next hourly close before deciding. If that candle prints lower volume and price stalls near 0.0994, the initial volume spike may have been a brief flare rather than sustained interest. Conversely, if the next candle holds gains on shrinking volume, the earlier surge could mark a genuine shift. Both paths are plausible from the same starting facts. The trade-off is entry quality versus chasing: acting on the first print risks a false start, while waiting risks missing a continuation. Neither choice is validated by the current snapshot alone.
What could change the reading
A second hourly candle that closes back below 0.0964151 with relative volume falling toward baseline would weaken the bullish interpretation. A close above 0.0994 on sustained or rising relative volume would strengthen it. Until such evidence arrives, the only honest stance is to treat the present observation as a single data point, not a signal.
Probabilistic market research, not a recommendation or guaranteed return.
#BARD
$BARD: BARD prints hourly gains while relative volume sits at 2.63x baseline. The observation raises a simple question: does a quick read of volume and price produce a useful pause or a rushed conclusion?
A common assumption
Traders often treat an above-baseline volume print alongside an up hourly candle as a green light to enter immediately. The logic feels intuitive: more activity plus higher price must mean conviction. Yet the saved record only shows that volume exceeded its recent average while price moved up inside the recorded range between 0.0933 and 0.0994. No order-flow data, motive, or causation is captured. RSI reads 45.0, and MACD sits at -0.000614565 versus signal -0.000532038. These are static readings from one closed candle, not forecasts.
The counterexample to consider
Imagine a participant who waits for the next hourly close before deciding. If that candle prints lower volume and price stalls near 0.0994, the initial volume spike may have been a brief flare rather than sustained interest. Conversely, if the next candle holds gains on shrinking volume, the earlier surge could mark a genuine shift. Both paths are plausible from the same starting facts. The trade-off is entry quality versus chasing: acting on the first print risks a false start, while waiting risks missing a continuation. Neither choice is validated by the current snapshot alone.
What could change the reading
A second hourly candle that closes back below 0.0964151 with relative volume falling toward baseline would weaken the bullish interpretation. A close above 0.0994 on sustained or rising relative volume would strengthen it. Until such evidence arrives, the only honest stance is to treat the present observation as a single data point, not a signal.
Probabilistic market research, not a recommendation or guaranteed return.
#BARD