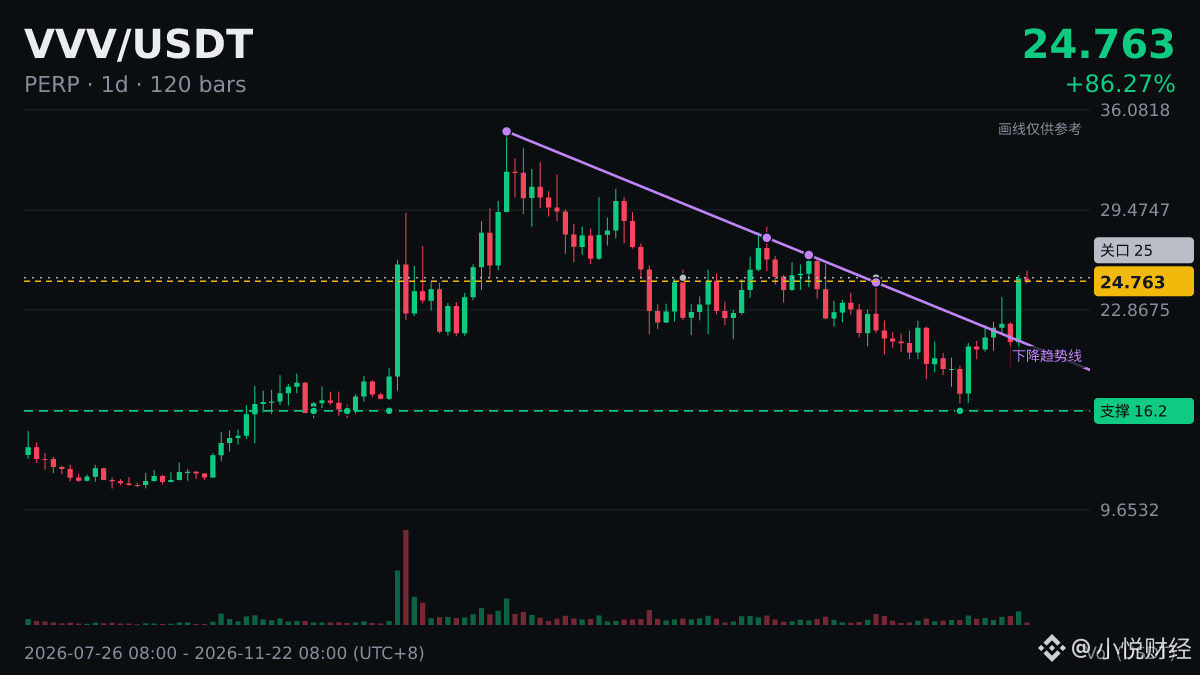
🐋 $VVV The daily chart has moved above MA50 (23.0412), up 19.36% in 24h.
Moving averages on the daily chart are levels many medium- to long-term investors watch, but first, let's understand how they're calculated.
On the daily chart, MA200 is the average closing price over the most recent 200 days and is often seen as the dividing line for the long-term trend. MA50 is commonly used to assess the medium-term trend.
Extreme readings often come with greater volatility. At times like these, it's better to reduce leverage rather than make a big bet.
#VVV
Moving averages on the daily chart are levels many medium- to long-term investors watch, but first, let's understand how they're calculated.
On the daily chart, MA200 is the average closing price over the most recent 200 days and is often seen as the dividing line for the long-term trend. MA50 is commonly used to assess the medium-term trend.
Extreme readings often come with greater volatility. At times like these, it's better to reduce leverage rather than make a big bet.
#VVV