$EVAA LONG
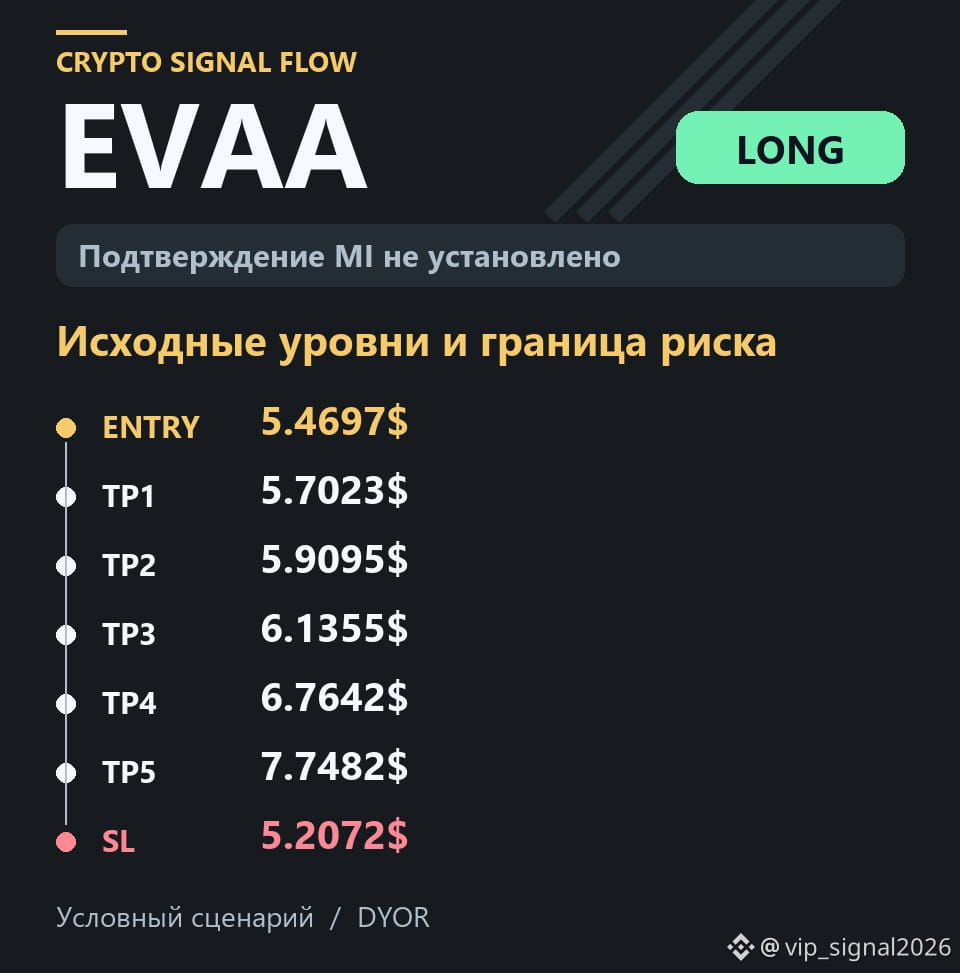
🏁Entry: 5.4697$
💰Target 1: 5.7023$
💰Target 2: 5.9095$
💰Target 3: 6.1355$
💰Target 4: 6.7642$
💰Target 5: 7.7482$
❌Stop-loss: 5.2072$
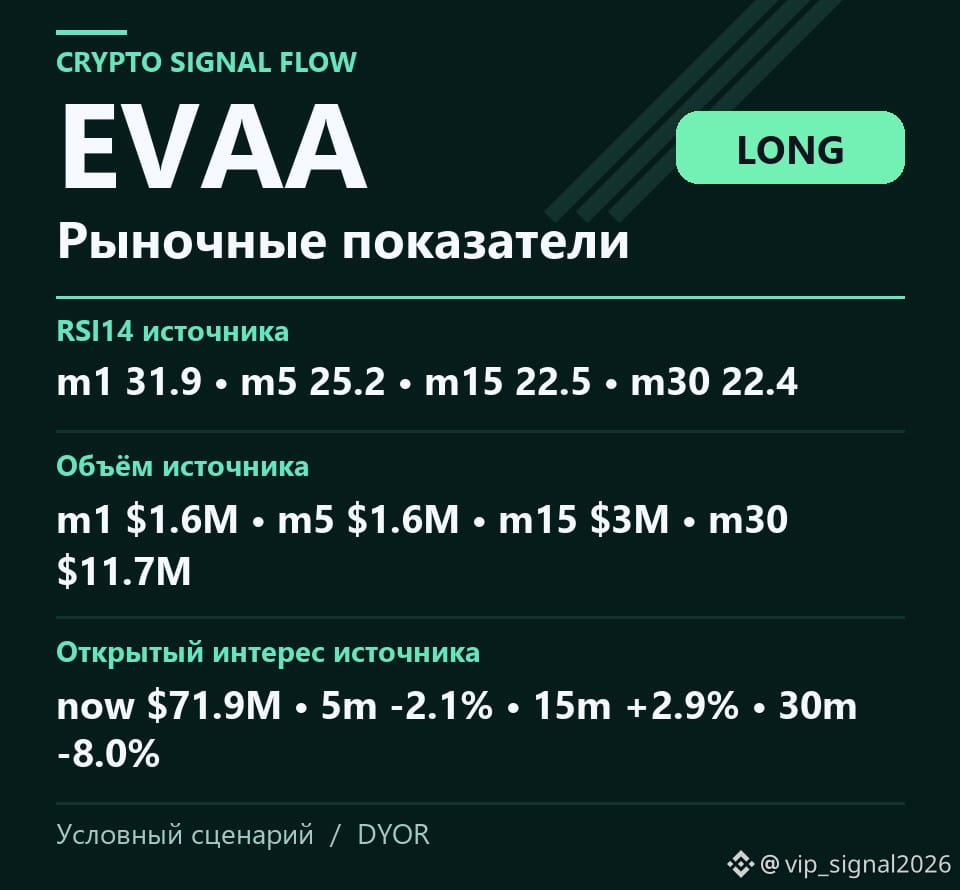
📈 RSI14: m1 31.9 • m5 25.2 • m15 22.5 • m30 22.4
📊 VOL: m1 $1.6M • m5 $1.6M • m15 $3M • m30 $11.7M
🧲 OI: now $71.9M • 5m -2.1% • 15m +2.9% • 30m -8.0%
RSI on the five-minute chart is in the oversold zone, while on the one-minute chart it is outside the extreme zones.
Is it time to buy if the five-minute chart has already plunged deep down, while the one-minute chart is still holding in the neutral zone? Let's look at this without illusions.
This kind of divergence between timeframes is often mistaken for a moment to jump into a long position. But if we assess the idea strictly through the lens of the original plan, this mismatch alone does not guarantee a reversal. The figures on one interval do not eliminate uncertainty on another.
RSI on the five-minute chart is in the oversold zone.
⚠️ Trading involves the risk of losses. This is not financial advice. You are responsible for your decisions. DYOR.
#EVAA #OpenInterest #TechnicalIndicators #TradingSignals
$EVAA
🏁Entry: 5.4697$
💰Target 1: 5.7023$
💰Target 2: 5.9095$
💰Target 3: 6.1355$
💰Target 4: 6.7642$
💰Target 5: 7.7482$
❌Stop-loss: 5.2072$
📈 RSI14: m1 31.9 • m5 25.2 • m15 22.5 • m30 22.4
📊 VOL: m1 $1.6M • m5 $1.6M • m15 $3M • m30 $11.7M
🧲 OI: now $71.9M • 5m -2.1% • 15m +2.9% • 30m -8.0%
RSI on the five-minute chart is in the oversold zone, while on the one-minute chart it is outside the extreme zones.
Is it time to buy if the five-minute chart has already plunged deep down, while the one-minute chart is still holding in the neutral zone? Let's look at this without illusions.
This kind of divergence between timeframes is often mistaken for a moment to jump into a long position. But if we assess the idea strictly through the lens of the original plan, this mismatch alone does not guarantee a reversal. The figures on one interval do not eliminate uncertainty on another.
RSI on the five-minute chart is in the oversold zone.
⚠️ Trading involves the risk of losses. This is not financial advice. You are responsible for your decisions. DYOR.
#EVAA #OpenInterest #TechnicalIndicators #TradingSignals
$EVAA