In this stretch before noon Sunday, about two hours have passed since the 8 a.m. funding settlement, and there are about six hours until the 4 p.m. one. Overseas markets are still closed for the weekend, and the Fear Index has plunged again, from around 12 to around 11. Some people are treating Cosmos falling about 4.1% during the day, while negative funding pays an exceptionally large subsidy far beyond the usual cap, as proof that this move has already flushed everyone out—that subsidies being paid means shorts have already surrendered, and they can call it a day before noon. The ledger tells a different story: one asset has slid from an intraday high of around 1.222 to near the intraday low of around 1.126, with the long share retreating from around 54% to around 52%; negative funding is paying an exceptionally large subsidy of around five times the usual cap, and contract count is still edging up. It remains in a weekly trough, down around 14%. Meanwhile, another asset in the same sector has fallen about 6%, with the long share pinned at around 46% and barely moving; it too has negative funding and is paying a hefty subsidy, while contract count has risen by around 3.5%, and it is down around 23%, farther from its weekly high.
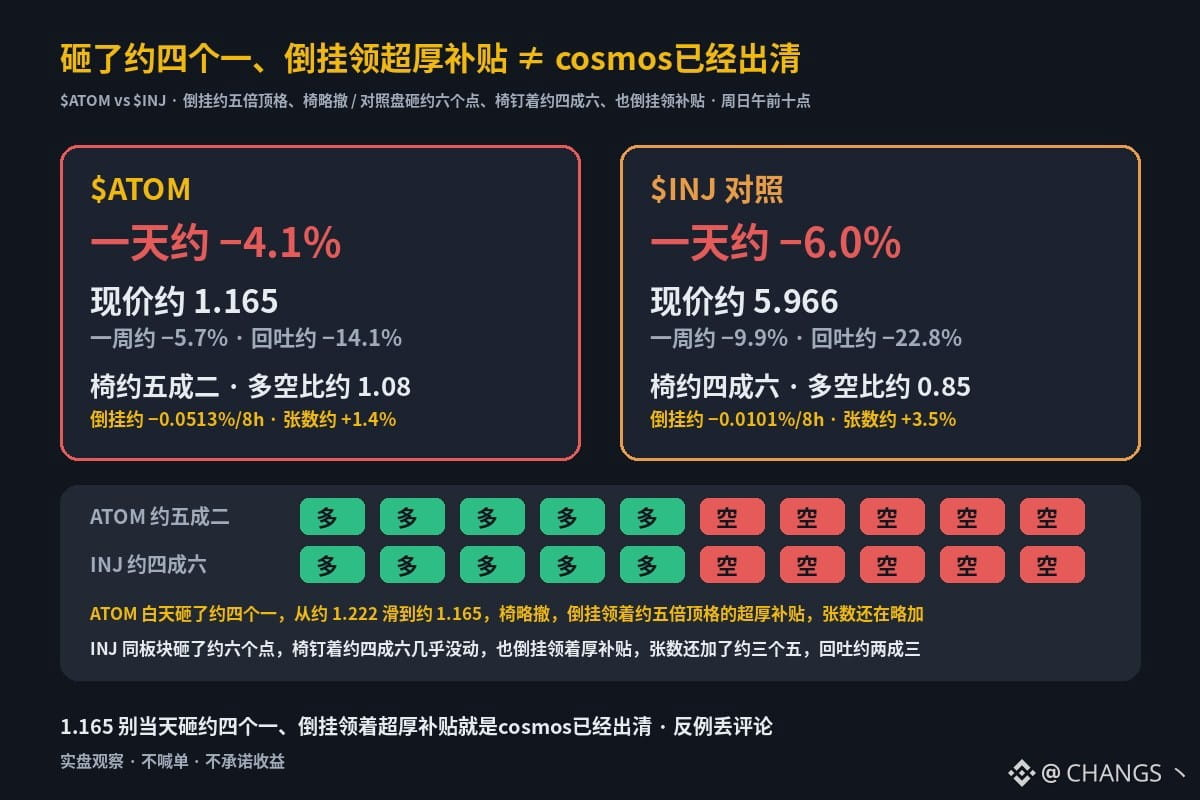
$ATOM: down around 4.1% over one day / around 5.7% over one week; current price around 1.165. Weekly high around 1.356, drawdown around −14.1%. Account long/short ratio around 1.08 (around 52% long; around one day ago, around 1.17 / 54%—the long share is retreating). Funding is inverted at around −0.0513%/8h, far beyond the usual cap and paying an exceptionally large subsidy. OI contract count over the past day is around +1.4% (U-margined around −2.8%; likely the price is falling while contract count is still edging up). Price has slid from an intraday high of around 1.222, near the intraday low of around 1.126; current price is around 1.165, still in a weekly trough. Don’t take 1.165, a roughly 4.1% daily drop, and negative funding paying an exceptionally large subsidy as proof that this move has already flushed everyone out. And don’t take the long share retreating only to around 52% and the Fear Index plunging again to around 11 as proof that shorts have already surrendered and you can call it a day before noon.
The other one, $INJ : down around 6.0% over one day / around 9.9% over one week; current price around 5.966. Weekly high around 7.732, drawdown around −22.8%. Long share around 46% (long/short ratio around 0.85; around one day ago, around 0.83 / 45%—the long share has barely moved). Funding is inverted at around −0.0101%/8h, paying a hefty subsidy. OI contract count over the past day is around +3.5% (U-margined around −2.8%; likely the price is falling while contract count is still increasing). Price has slid from an intraday high of around 6.36, near the intraday low of around 5.843; current price is around 5.966, still in a weekly trough. The long share is pinned at around 46% and has barely moved; funding is inverted and paying a hefty subsidy, while contract count has risen by around 3.5%.
One asset fell around 4.1% during the day, sliding from around 1.222 to around 1.165 for a drawdown of around 14%; its long share retreated from around 54% to around 52%, negative funding paid an exceptionally large subsidy of around five times the usual cap, and contract count is still edging up. The other asset in the same sector fell around 6%, with a drawdown of around 23%; its long share stayed pinned at around 46% and barely moved, funding was also inverted and paid a hefty subsidy, and contract count rose by around 3.5%, leaving it farther from its weekly high. Does a roughly 4.1% drop and negative funding paying an exceptionally large subsidy far beyond the usual cap mean Cosmos has already flushed everyone out and shorts have surrendered? Or is it just an asset still in a weekly trough, with the long share retreating only partway, negative funding paying a subsidy around five times the usual cap, and contract count still edging up—especially when its comparison asset has fallen further, is down around 23%, has its long share pinned at around 46%, and also has inverted funding paying a hefty subsidy while contract count continues to rise? Post counterexamples in the comments.
$ATOM: down around 4.1% over one day / around 5.7% over one week; current price around 1.165. Weekly high around 1.356, drawdown around −14.1%. Account long/short ratio around 1.08 (around 52% long; around one day ago, around 1.17 / 54%—the long share is retreating). Funding is inverted at around −0.0513%/8h, far beyond the usual cap and paying an exceptionally large subsidy. OI contract count over the past day is around +1.4% (U-margined around −2.8%; likely the price is falling while contract count is still edging up). Price has slid from an intraday high of around 1.222, near the intraday low of around 1.126; current price is around 1.165, still in a weekly trough. Don’t take 1.165, a roughly 4.1% daily drop, and negative funding paying an exceptionally large subsidy as proof that this move has already flushed everyone out. And don’t take the long share retreating only to around 52% and the Fear Index plunging again to around 11 as proof that shorts have already surrendered and you can call it a day before noon.
The other one, $INJ : down around 6.0% over one day / around 9.9% over one week; current price around 5.966. Weekly high around 7.732, drawdown around −22.8%. Long share around 46% (long/short ratio around 0.85; around one day ago, around 0.83 / 45%—the long share has barely moved). Funding is inverted at around −0.0101%/8h, paying a hefty subsidy. OI contract count over the past day is around +3.5% (U-margined around −2.8%; likely the price is falling while contract count is still increasing). Price has slid from an intraday high of around 6.36, near the intraday low of around 5.843; current price is around 5.966, still in a weekly trough. The long share is pinned at around 46% and has barely moved; funding is inverted and paying a hefty subsidy, while contract count has risen by around 3.5%.
One asset fell around 4.1% during the day, sliding from around 1.222 to around 1.165 for a drawdown of around 14%; its long share retreated from around 54% to around 52%, negative funding paid an exceptionally large subsidy of around five times the usual cap, and contract count is still edging up. The other asset in the same sector fell around 6%, with a drawdown of around 23%; its long share stayed pinned at around 46% and barely moved, funding was also inverted and paid a hefty subsidy, and contract count rose by around 3.5%, leaving it farther from its weekly high. Does a roughly 4.1% drop and negative funding paying an exceptionally large subsidy far beyond the usual cap mean Cosmos has already flushed everyone out and shorts have surrendered? Or is it just an asset still in a weekly trough, with the long share retreating only partway, negative funding paying a subsidy around five times the usual cap, and contract count still edging up—especially when its comparison asset has fallen further, is down around 23%, has its long share pinned at around 46%, and also has inverted funding paying a hefty subsidy while contract count continues to rise? Post counterexamples in the comments.