#全球股市创三年来最长连跌 The stock market has been falling for days, and $BTC hasn’t escaped the drop either.
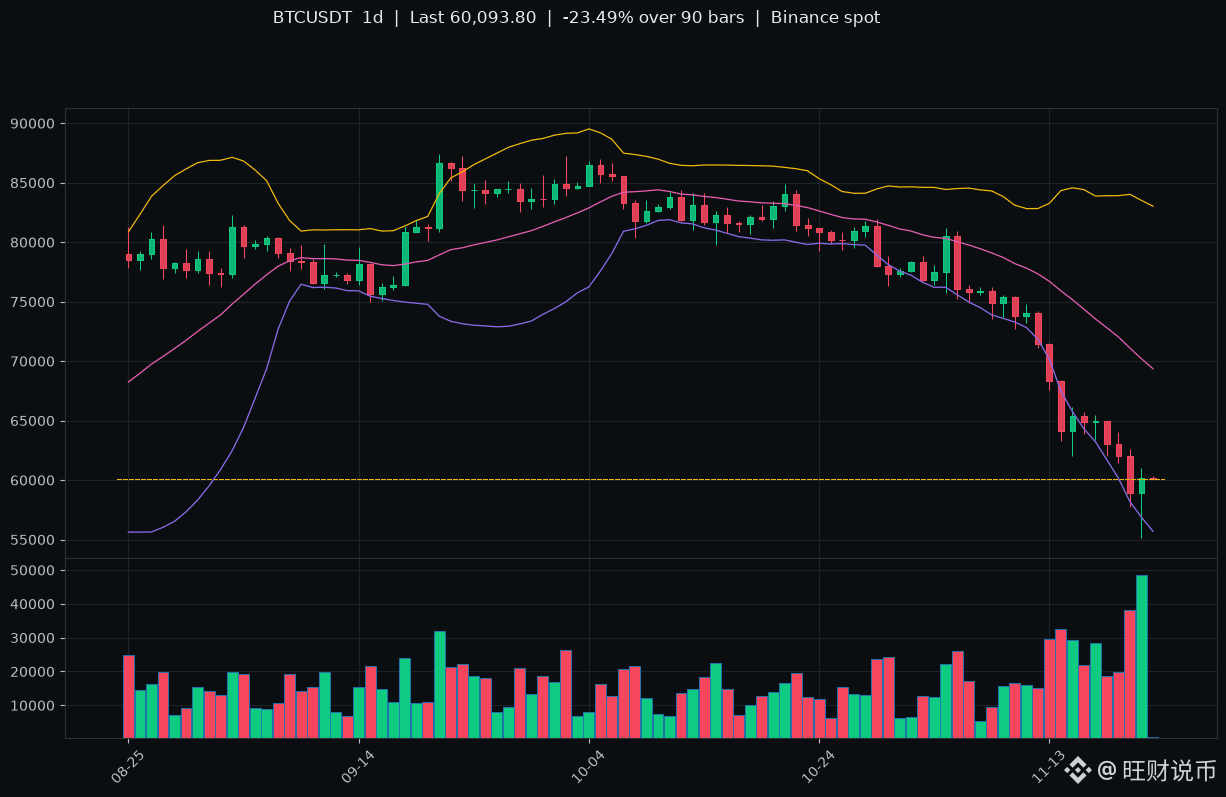
90-day daily chart: high 87395 → low 55130, down about 23.5%; current price 60093.
The daily Bollinger lower band is at 55695, right around the wick at 55130, while the middle band at 69360 is still far away.
1. Holding 55130 would only mean the decline has stalled, not that the trend has reversed.
2. A daily close above the 69360 middle band would mean the trend has recovered.
3. If the daily close falls below 55130, I’ll admit I was wrong and keep watching for a move below the lower band.
Stocks and crypto are moving up and down together right now; safe-haven buyers haven’t arrived yet.
Do you think 60,000 is the bottom or just a pit stop? Bullish or bearish? Just leave one word.
#BTC #ContentMining
Just my personal opinion. Be aware of the risks. DYOR.
90-day daily chart: high 87395 → low 55130, down about 23.5%; current price 60093.
The daily Bollinger lower band is at 55695, right around the wick at 55130, while the middle band at 69360 is still far away.
1. Holding 55130 would only mean the decline has stalled, not that the trend has reversed.
2. A daily close above the 69360 middle band would mean the trend has recovered.
3. If the daily close falls below 55130, I’ll admit I was wrong and keep watching for a move below the lower band.
Stocks and crypto are moving up and down together right now; safe-haven buyers haven’t arrived yet.
Do you think 60,000 is the bottom or just a pit stop? Bullish or bearish? Just leave one word.
#BTC #ContentMining
Just my personal opinion. Be aware of the risks. DYOR.