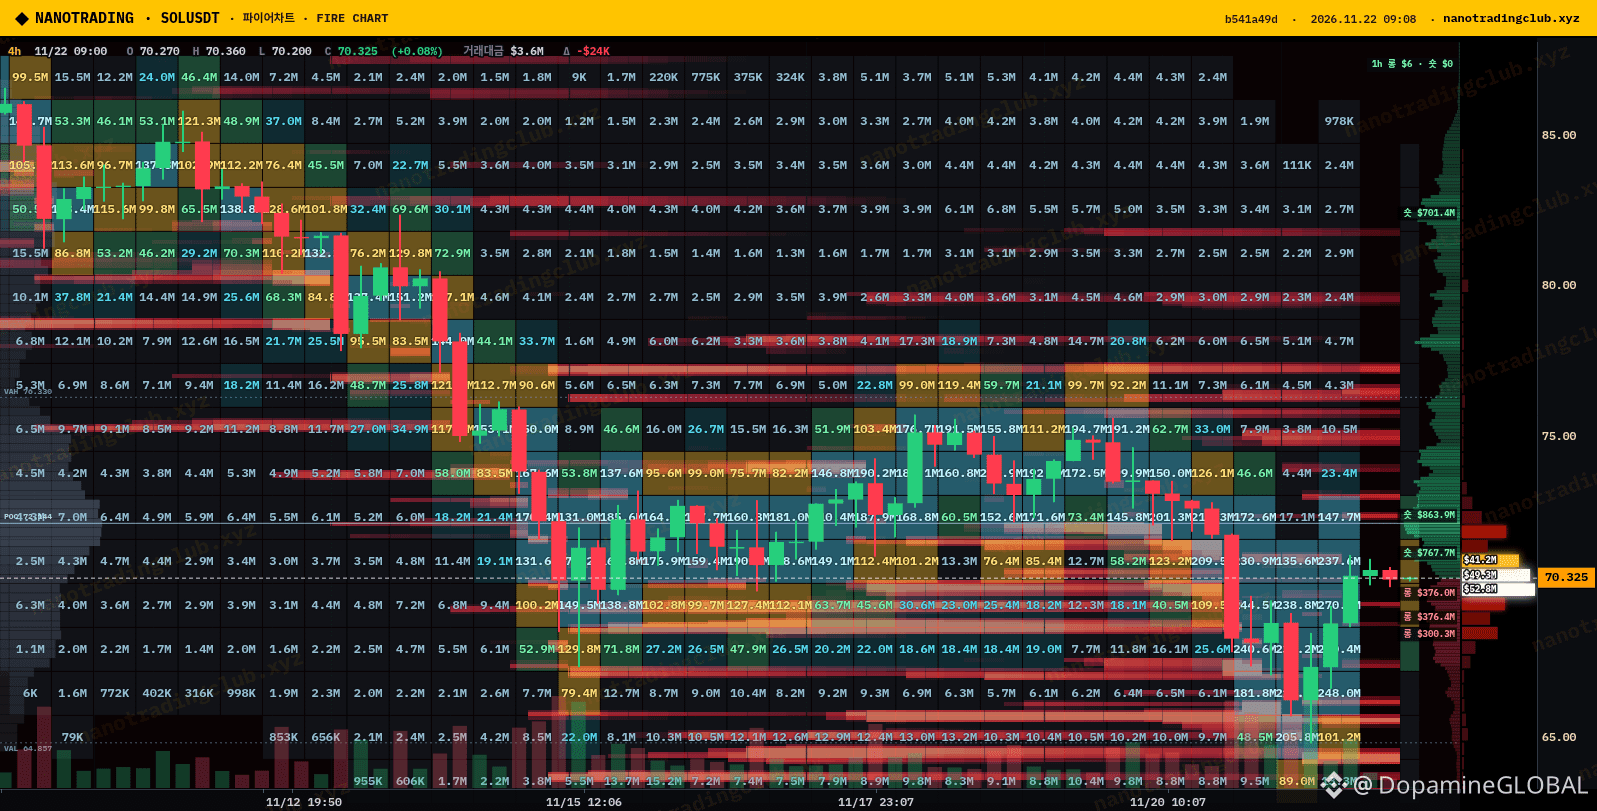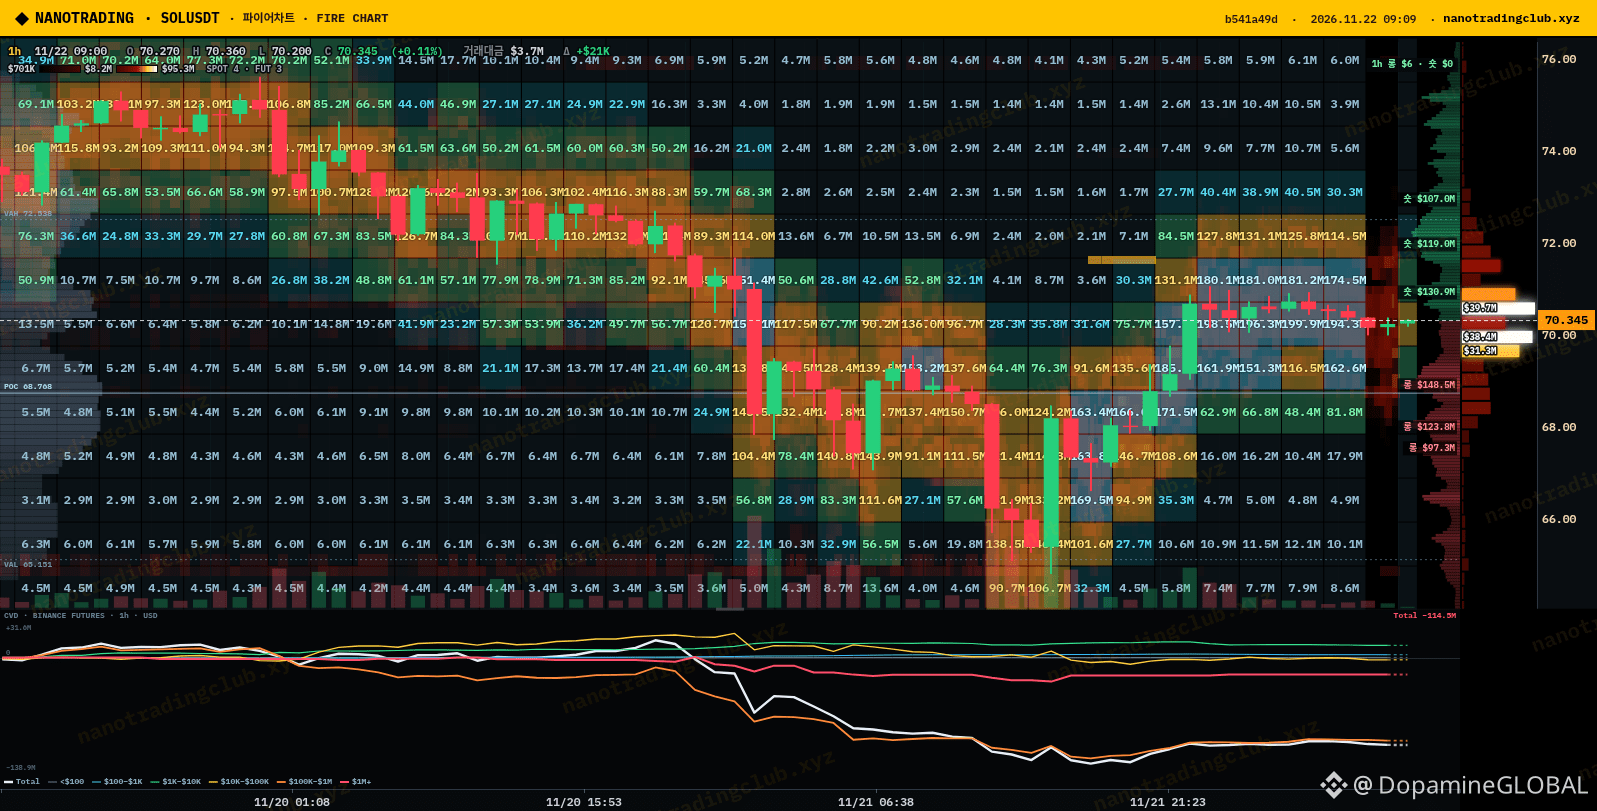
Quick tip using $SOL this morning, because a lot of people mix up a liquidation heatmap and a liquidity/orderbook heatmap. On the liquidation map, the bright bands show where leveraged positions get forced out. Price tends to get pulled toward the dense clusters, since that's where the fuel is.
The orderbook heatmap is a different thing. It shows resting limit orders, and walls near price can be pulled or moved in seconds (spoofing is real). So I never trust a wall on its own. I check it against the liquidation zones and only take it seriously when both line up.
The real example: with $SOL around 70.3, the 4h liquidation map has its biggest cluster above at about 73.8, mostly short liquidations in the 73-76 zone. The heavy band below sits around 64.4-65.9, mostly longs. The 1h book near price only had small walls, roughly 70.41 ask and 70.30 bid, and about $1.6M stacked on each side within a few ticks. Pretty balanced, nothing pushing it either way yet 🧐
Charts: NanoTrading Fire chart (nanotradingclub.xyz)
Which magnet gets tagged first in your view, the 73-76 shorts or the 64-66 longs?
Not financial advice, just how I read the map.
#SOL #Solana #TradingTips #NanoTrading
The orderbook heatmap is a different thing. It shows resting limit orders, and walls near price can be pulled or moved in seconds (spoofing is real). So I never trust a wall on its own. I check it against the liquidation zones and only take it seriously when both line up.
The real example: with $SOL around 70.3, the 4h liquidation map has its biggest cluster above at about 73.8, mostly short liquidations in the 73-76 zone. The heavy band below sits around 64.4-65.9, mostly longs. The 1h book near price only had small walls, roughly 70.41 ask and 70.30 bid, and about $1.6M stacked on each side within a few ticks. Pretty balanced, nothing pushing it either way yet 🧐
Charts: NanoTrading Fire chart (nanotradingclub.xyz)
Which magnet gets tagged first in your view, the 73-76 shorts or the 64-66 longs?
Not financial advice, just how I read the map.
#SOL #Solana #TradingTips #NanoTrading