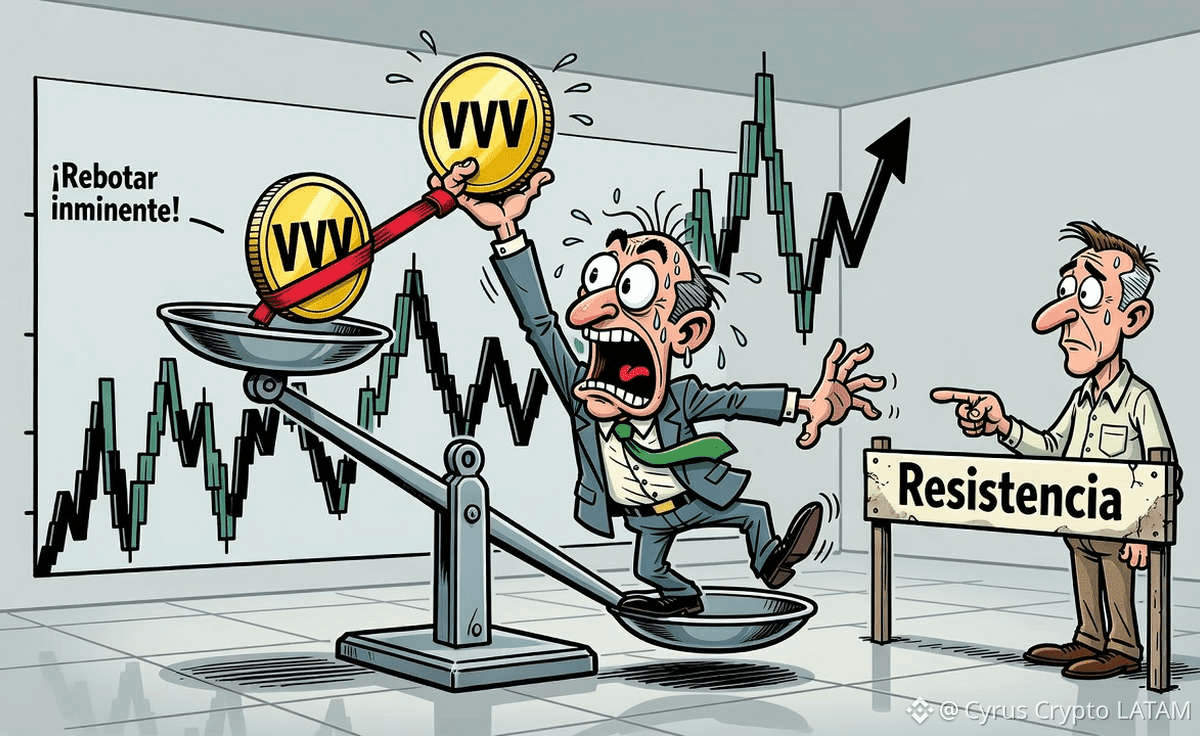
$VVV rises 23.40% on November 21, 2026, and approaches key resistance
#VVV reports a gain of 23.40% and daily volume 92.15% above its 30-day average, with the price near the technical resistance level of USD $25.10. Reports of a token transfer to Arthur Hayes and expanded access on exchanges are possible factors, but do not confirm the cause of the rally.
The change reported by the provider is 23.40% over 24 hours; comparing the price of USD $24.96 with the previous close of USD $20.23 gives a calculated change of 23.38%. The reported daily range was USD $20.00 to USD $24.96, and the opening price of USD $20.08 falls within that range.
The reported market capitalization is USD $1.23 billion, but the circulating supply, total supply, issuance schedule, and holder distribution are not detailed. Without this data, it is not possible to responsibly calculate future dilution or ownership concentration.
Recommendation: HOLD for anyone already holding a position, and wait before making new entries. The methodology considers five signals: structure relative to moving averages, MACD, RSI, volume, and extension relative to VWAP/stochastic. Three favor a bullish bias—the price is above the SMAs, the MACD histogram is positive, and volume is 92.15% above its 30-day average—while two suggest caution: the stochastic is at 100, and the price is 12.05% above the intraday VWAP. An RSI of 60.1 is not decisively bearish or bullish on its own.
For the short term, consider an entry conditional on a close and hold above USD $25.10, with partial profit-taking at the projected reference level of USD $27.31 and the next zone at USD $30.04. A stop-loss should be set according to risk tolerance and below the USD $22.27–USD $22.89 zone, bearing in mind that slippage may occur.
#VVV reports a gain of 23.40% and daily volume 92.15% above its 30-day average, with the price near the technical resistance level of USD $25.10. Reports of a token transfer to Arthur Hayes and expanded access on exchanges are possible factors, but do not confirm the cause of the rally.
The change reported by the provider is 23.40% over 24 hours; comparing the price of USD $24.96 with the previous close of USD $20.23 gives a calculated change of 23.38%. The reported daily range was USD $20.00 to USD $24.96, and the opening price of USD $20.08 falls within that range.
The reported market capitalization is USD $1.23 billion, but the circulating supply, total supply, issuance schedule, and holder distribution are not detailed. Without this data, it is not possible to responsibly calculate future dilution or ownership concentration.
Recommendation: HOLD for anyone already holding a position, and wait before making new entries. The methodology considers five signals: structure relative to moving averages, MACD, RSI, volume, and extension relative to VWAP/stochastic. Three favor a bullish bias—the price is above the SMAs, the MACD histogram is positive, and volume is 92.15% above its 30-day average—while two suggest caution: the stochastic is at 100, and the price is 12.05% above the intraday VWAP. An RSI of 60.1 is not decisively bearish or bullish on its own.
For the short term, consider an entry conditional on a close and hold above USD $25.10, with partial profit-taking at the projected reference level of USD $27.31 and the next zone at USD $30.04. A stop-loss should be set according to risk tolerance and below the USD $22.27–USD $22.89 zone, bearing in mind that slippage may occur.