A quick look at #BTC against #USDT ⚡
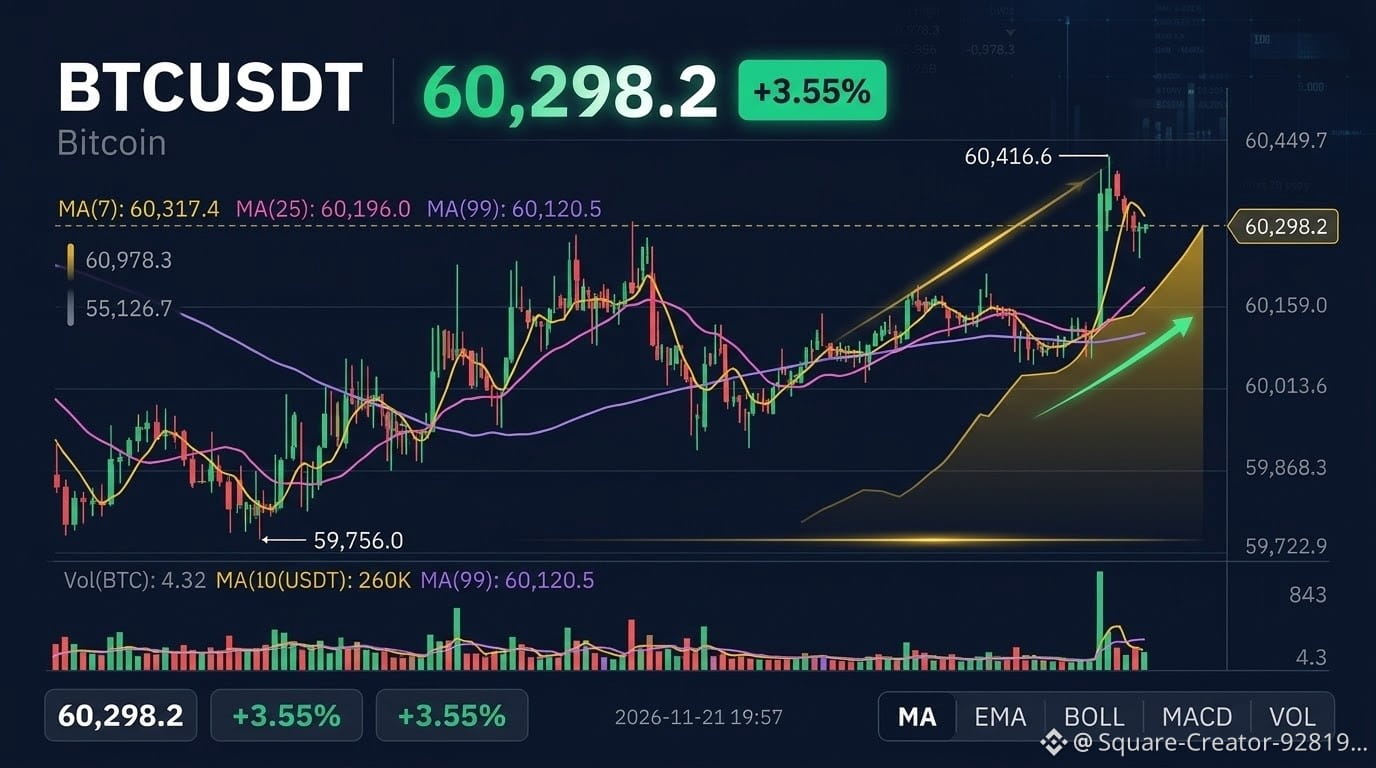
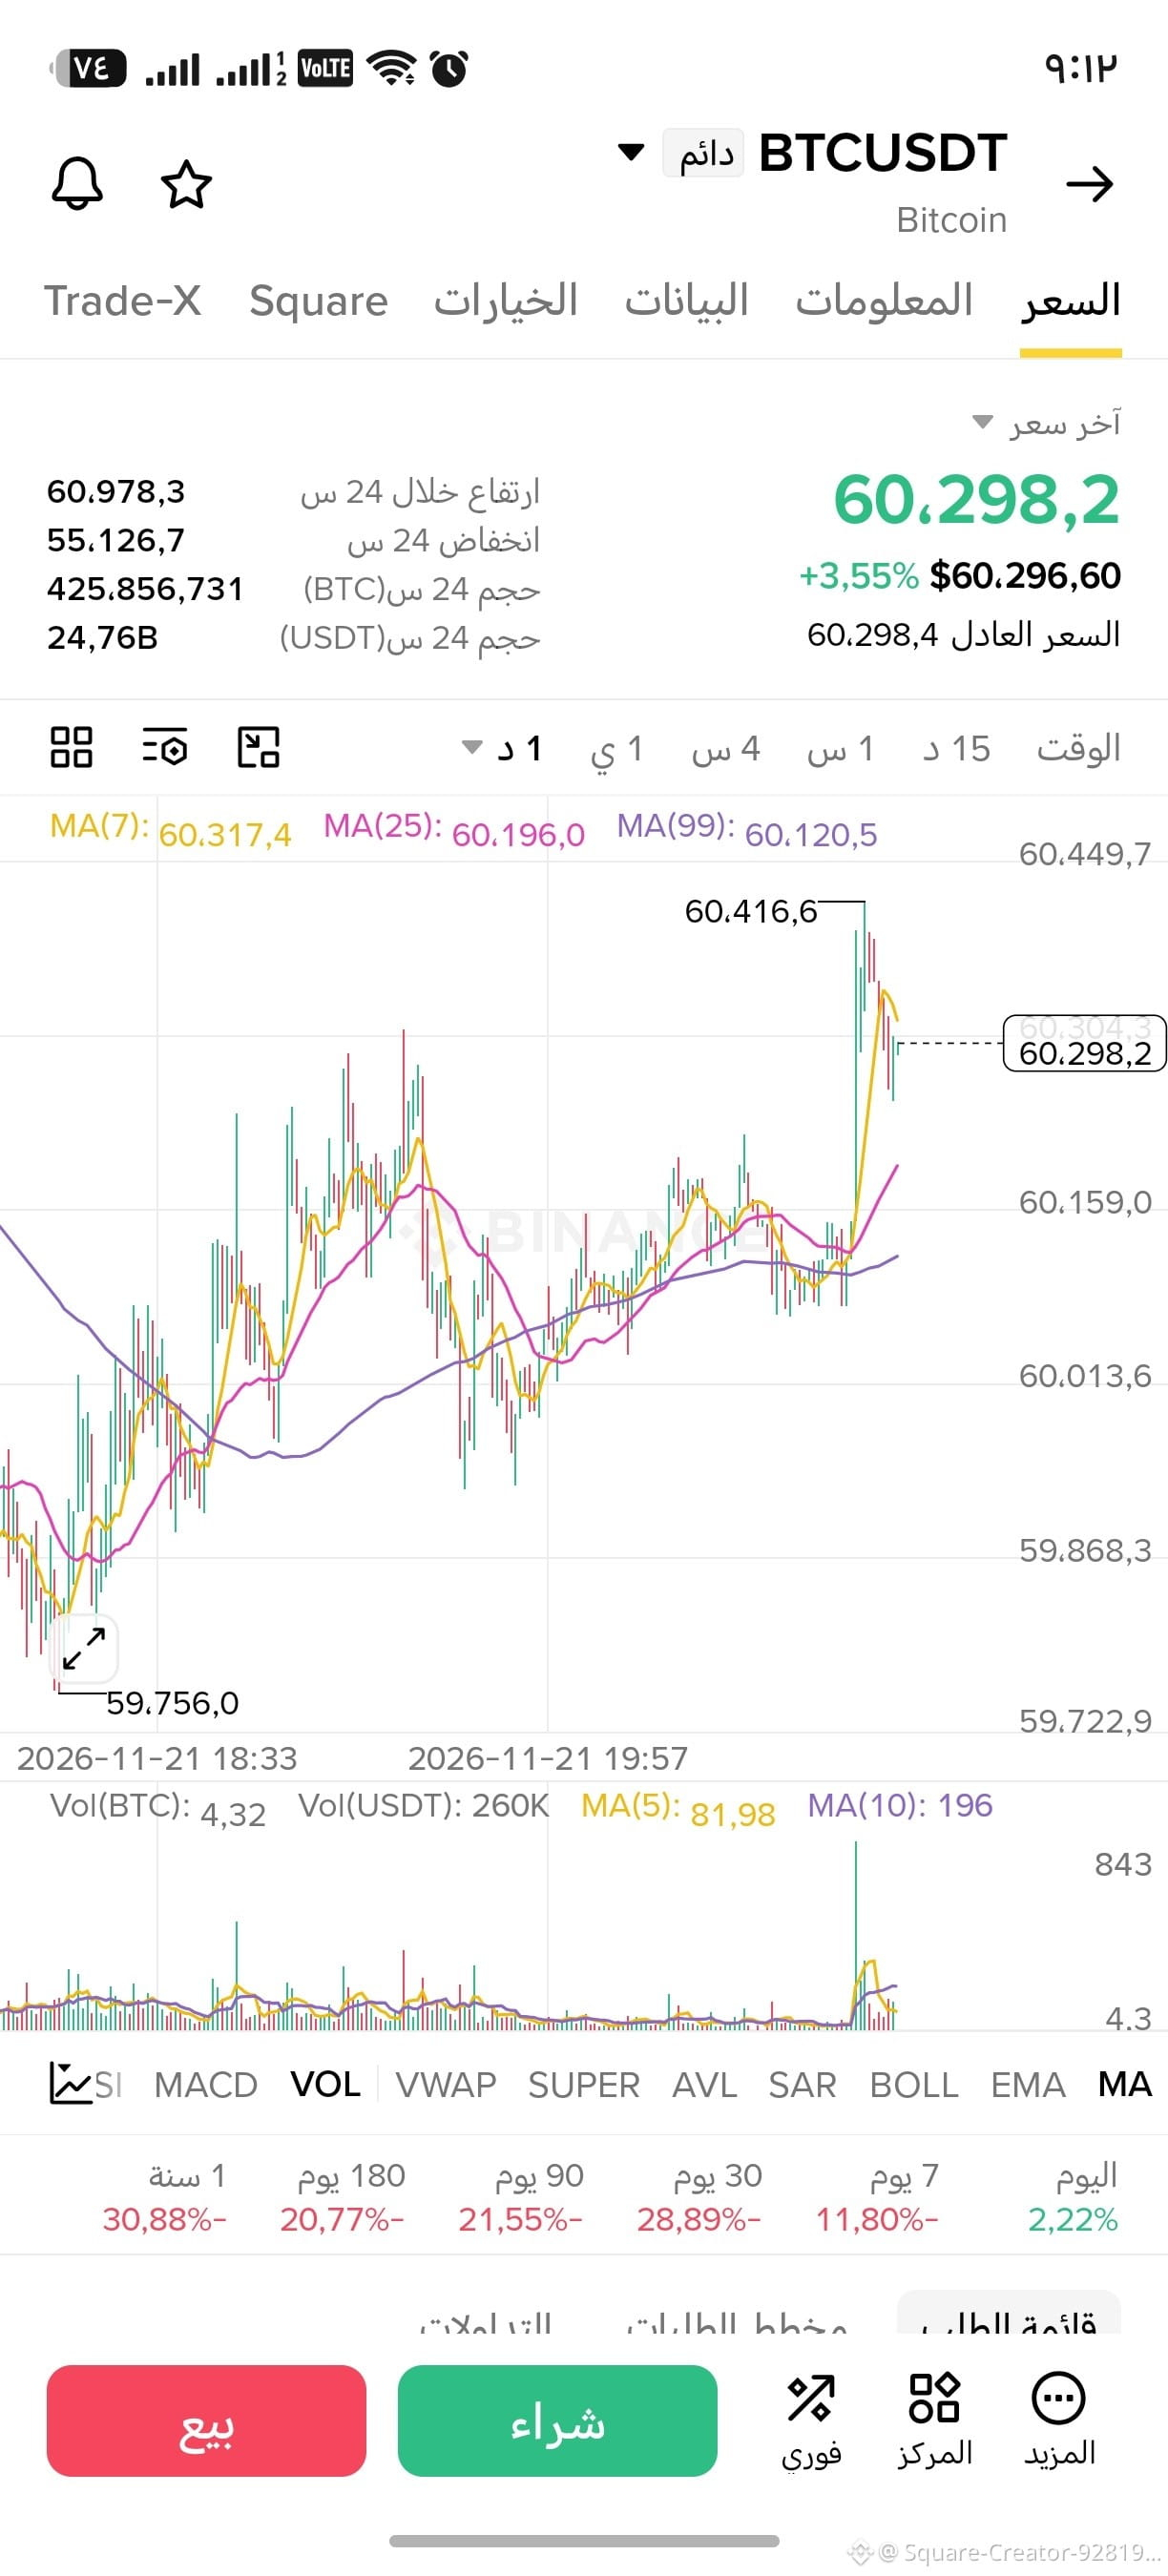
The price is currently trading at 60,298.2 USDT (with a fair price of 60,298.4), up approximately +3.55% over the last 24 hours. This follows a strong upward move that broke through previous accumulation zones and reached a clear high near 60,416.6, within the 24-hour range of 55,126.7 to 60,978.3.
What does the chart show?
The price is trading above the nearby moving averages (MA25 at 60,196.0 and MA99 at 60,120.5), while dipping slightly below MA7 at 60,317.4 after reaching a high of 60,416.6. This puts it in a phase of testing and determining its short-term direction.
Bullish scenario: Holding steady and moving back above 60,320–60,420, supported by trading volume, would strengthen the chances of the momentum continuing toward 60,450, followed by a test of higher levels toward the daily high range of 60,978.3.
Cautious scenario: A pullback and break below the 60,196–60,120 zone could open the way for a retest of lower levels near 60,013.6 and then 59,868.3.
A constant reminder: The market depends on liquidity and probabilities. Sticking to risk management and using a stop-loss are essential when trading perpetual contracts.
In your opinion, will BTC hold above 60,200 and target new highs, or will we see a cooldown and a test of nearby support levels? Share your thoughts in the comments 👇
#BTC #Bitcoin #BinanceSquare #Crypto #TechnicalAnalysis
The price is currently trading at 60,298.2 USDT (with a fair price of 60,298.4), up approximately +3.55% over the last 24 hours. This follows a strong upward move that broke through previous accumulation zones and reached a clear high near 60,416.6, within the 24-hour range of 55,126.7 to 60,978.3.
What does the chart show?
The price is trading above the nearby moving averages (MA25 at 60,196.0 and MA99 at 60,120.5), while dipping slightly below MA7 at 60,317.4 after reaching a high of 60,416.6. This puts it in a phase of testing and determining its short-term direction.
Bullish scenario: Holding steady and moving back above 60,320–60,420, supported by trading volume, would strengthen the chances of the momentum continuing toward 60,450, followed by a test of higher levels toward the daily high range of 60,978.3.
Cautious scenario: A pullback and break below the 60,196–60,120 zone could open the way for a retest of lower levels near 60,013.6 and then 59,868.3.
A constant reminder: The market depends on liquidity and probabilities. Sticking to risk management and using a stop-loss are essential when trading perpetual contracts.
In your opinion, will BTC hold above 60,200 and target new highs, or will we see a cooldown and a test of nearby support levels? Share your thoughts in the comments 👇
#BTC #Bitcoin #BinanceSquare #Crypto #TechnicalAnalysis