
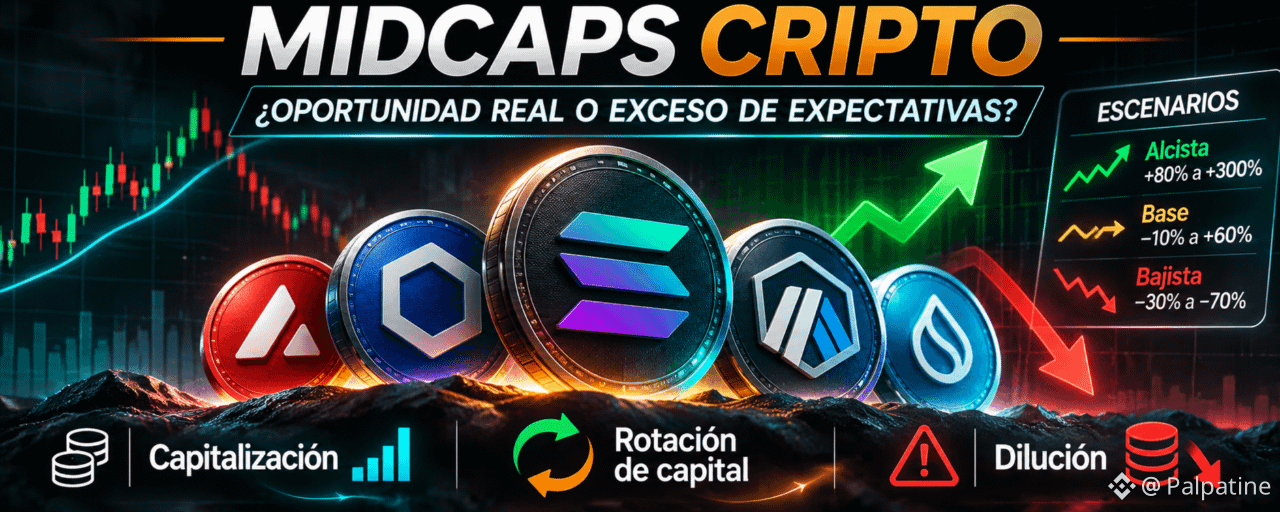

AKT, MORPHO, and SEI vs. RENDER, AAVE, and SUI: three projects, three valuations, and an uncomfortable question for the market.
Market research · November 21, 2026 · Tracking horizon: 6 to 12 months.
The crypto market is in the red, and many investors are looking only at which tokens have lost the most. But there’s another radar: projects with identifiable businesses trading far below better-valued competitors. Is there a real opportunity, or is the difference perfectly justified?
We analyze three projects operating in different sectors: $AKT (decentralized computing and artificial intelligence), $MORPHO (DeFi lending), and $SEI (Layer 1 blockchain). The surprise is that the candidate with the highest mathematical multiplier is not necessarily the one with the best risk/reward ratio.
1. Three projects compared with giants in their sectors
ProjectReference priceMarket capCompared rivalRival valueAKTUS$0,509US$153 MRENDERUS$723 MMORPHOUS$1,57US$1.109 MAAVEUS$1.540 MSEIUS$0,0351US$274 MSUIUS$2.670 M
The gap looks enormous: AKT is worth approximately 21% of RENDER; MORPHO, 72% of AAVE; SEI, just 10% of SUI. But a smaller token is not automatically a cheap token.
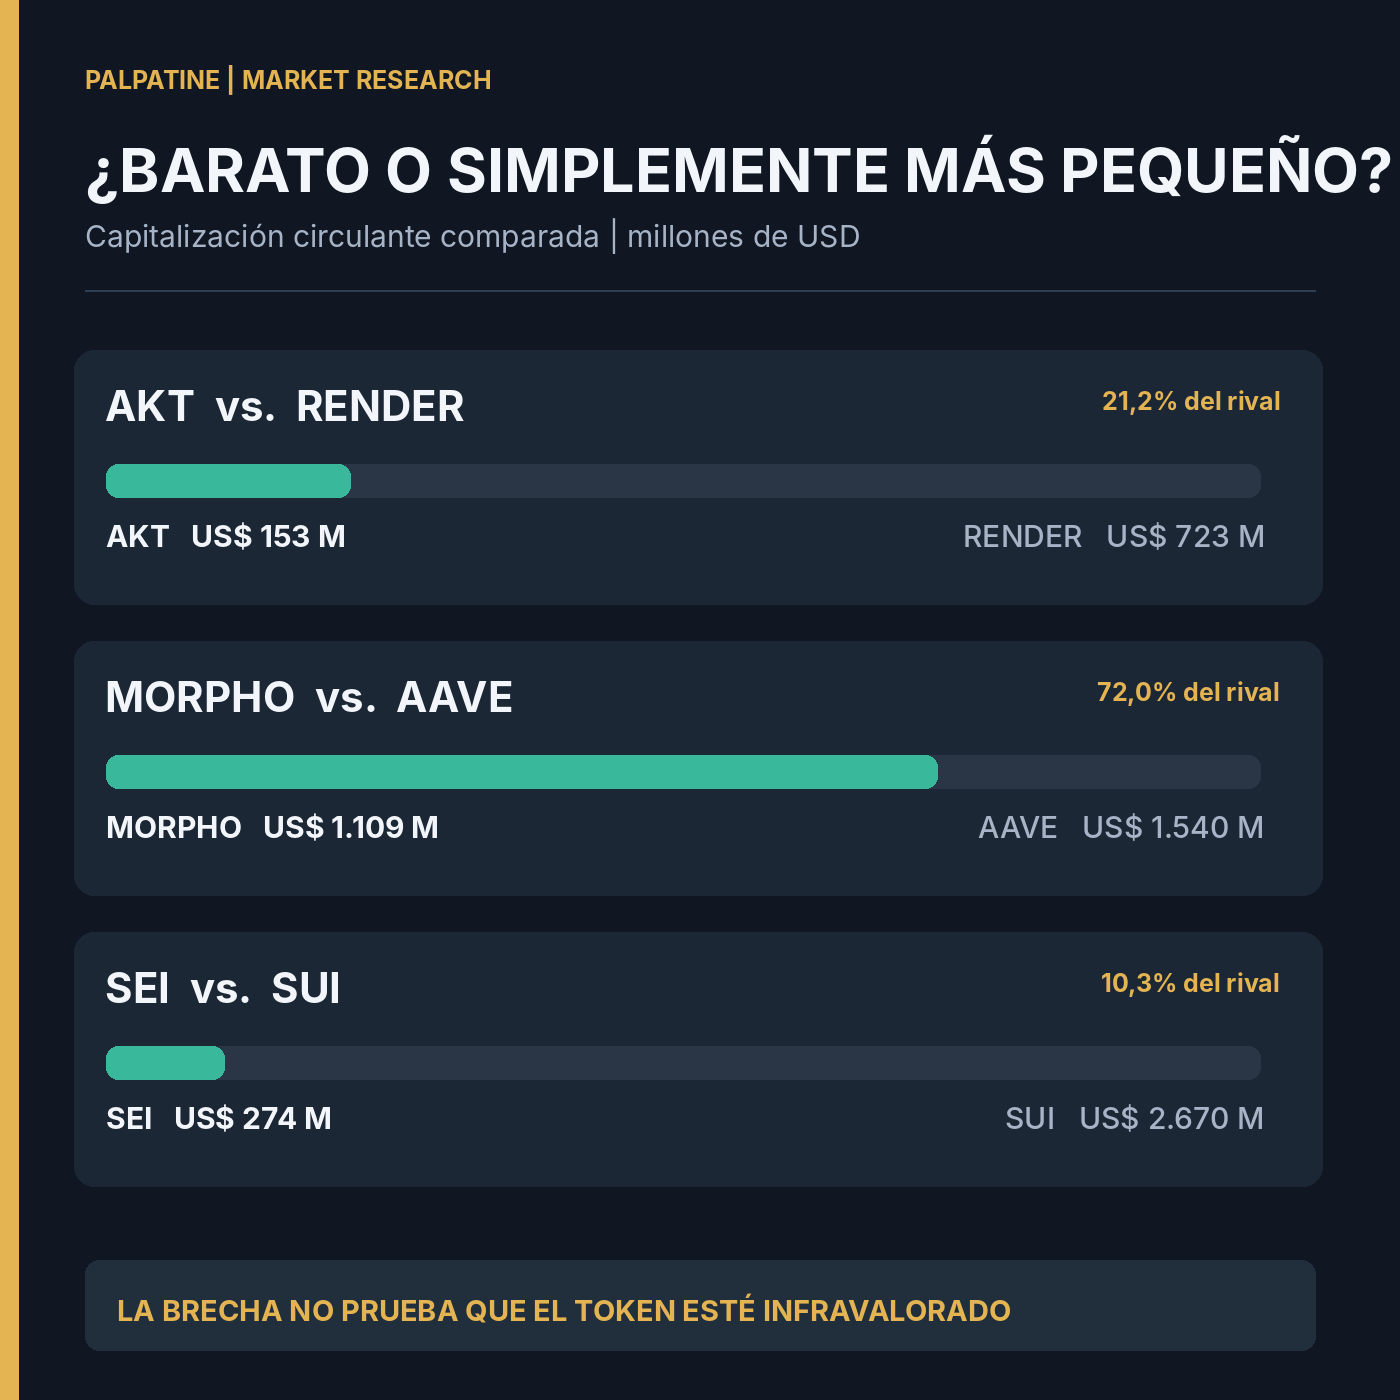
Infographic 1 · Palpatine Market Research · 21/11/2026
2. The calculation that generates “×5” or “×10” headlines
The logic is simple: imagine a project reaches 25%, 50%, or 100% of its rival’s market cap. Divide that value by its circulating tokens and you get a theoretical price.
With the current supply unchanged, the scenarios are as follows:
Token25% of rival50% of rival100% of rivalAKTUS$0,602US$1,204US$2,408MORPHOUS$0,545US$1,091US$2,181SEIUS$0,0854US$0,1707US$0,3415
If they reached exactly 100% of their rival’s value, AKT would be equivalent to about 4.7 times its reference price; MORPHO, 1.4 times; and SEI, approximately 9.7 times. These are valuation comparisons, NOT forecasts or probabilities of it happening.
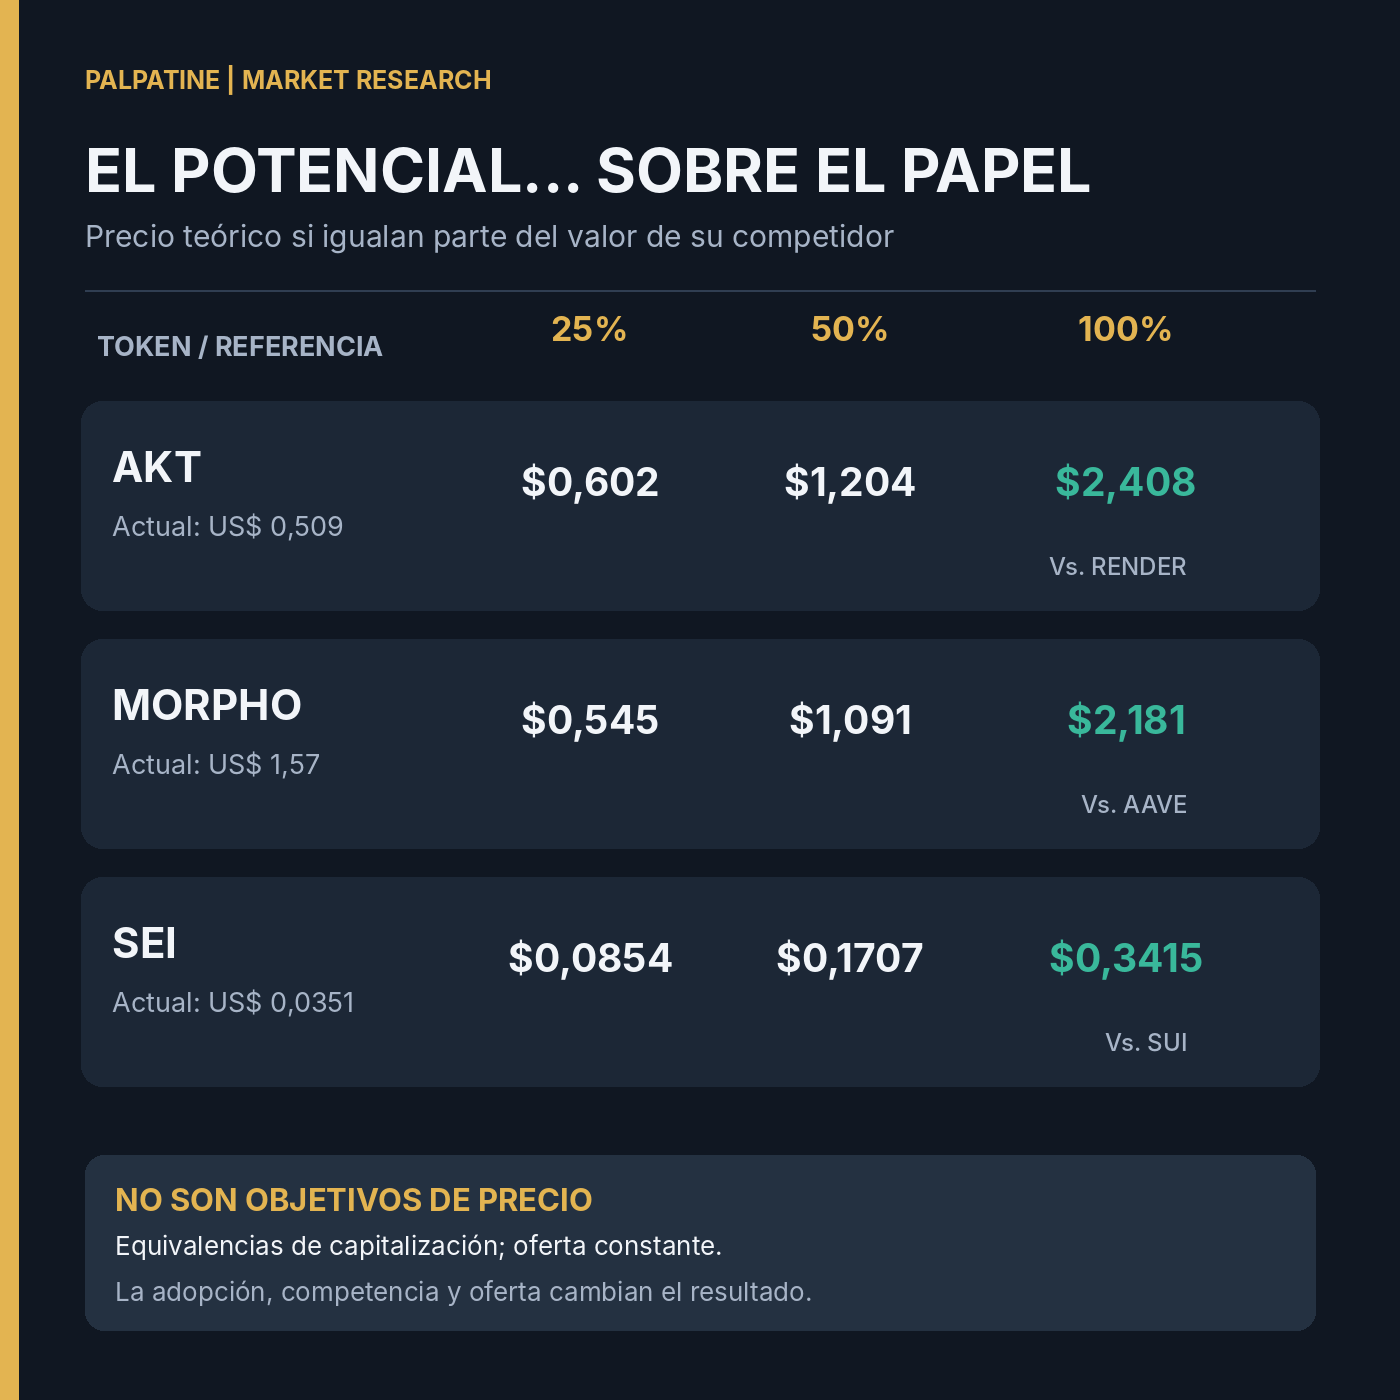
Infographic 2 · Palpatine Market Research · 21/11/2026
3. AKT: the candidate worth watching
Akash Network offers decentralized infrastructure for computing and GPUs: an activity connected to real demand, especially in artificial intelligence services. Its Burn-Mint Equilibrium mechanism seeks to link capacity consumption with the token economy. If utilization increases and burns have a sufficient impact, a concrete demand thesis emerges.
A migration to Solana is also underway. The official documentation describes a 1:1 AKT transfer mechanism, but the transition involves technical, liquidity, and execution risks; it is not an improvement guaranteed by decree.
The positives: a smaller market cap than RENDER and a possible connection between the business and the token. The weaknesses: it still needs to demonstrate commercial scale, growth in GPU demand, and that the token economy can offset emissions. Its supply benchmark is close to 300 million AKT, with an assumed annual inflation rate of 4% for our exercise.
Assessment: 7/10 in qualitative relative attractiveness, not probability of success. It is the one we would put at the top of our watchlist for the next 6–12 months, contingent on adoption and execution.
4. MORPHO: a great business does not guarantee a great token
Morpho operates in one of decentralized finance’s most important businesses: lending. At the snapshot analyzed, it recorded approximately US$9.460 billion in TVL and US$4.827 billion in active loans.
However, there is a crucial distinction: fees generated by a protocol are not automatically income for those who hold its token. DefiLlama’s measurement showed US$36.69 million in 30-day fees, but zero protocol revenue under that methodology. This does not mean that can never change: it means we cannot assume that profits are distributed to MORPHO holders.
The token is already around 72% of AAVE’s value. Even if it matched AAVE’s current market cap, the theoretical price without dilution would be US$2.181: approximately 39% above US$1.57. In addition, the token unlock schedule may increase available supply and put pressure on the price.
Assessment: 5/10. A relevant protocol, but price and value capture matter just as much as the amount of deposits.
5. SEI: the most spectacular potential… and the biggest warning
By market cap, SEI looks like the big winner of this exercise: US$274 million versus SUI’s US$2.670 billion. The mathematical market parity is striking.
But let’s look at the activity underpinning those valuations:
Network usageSEISUITVL in DeFi~US$19 M~US$325 MStablecoins~US$38 M~US$588 MDaily DEX volume~US$6.3 M~US$34.3 M
SUI has approximately 17 times more TVL and 15 times more stablecoin market cap. In other words, the market value gap did not appear out of nowhere. SEI needs to significantly increase its real-world adoption to justify closing that gap.
In addition, there is a methodological discrepancy regarding circulating supply: some sources report around 7.820 billion SEI, while others show approximately 6.733 billion. This is not a minor detail: it changes the price-per-token calculation. There are also scheduled unlocks whose scale and timing should be monitored.
Assessment: 4/10. The highest multiplier on paper, but lower fundamental visibility and considerable supply risk.
6. The variable that can invalidate the calculation: dilution
A token can increase its market cap and still underperform expectations if the number of circulating units grows substantially. That is why we repeat the parity exercise against the rival using explicit 12-month assumptions:
AssetHypothetical additional supplyTheoretical price without adjustmentWith projected supplyAKT+4.0%US$2.408US$2.32MORPHO+14.7%US$2.181US$1.90SEI+18.6%US$0.3415US$0.288
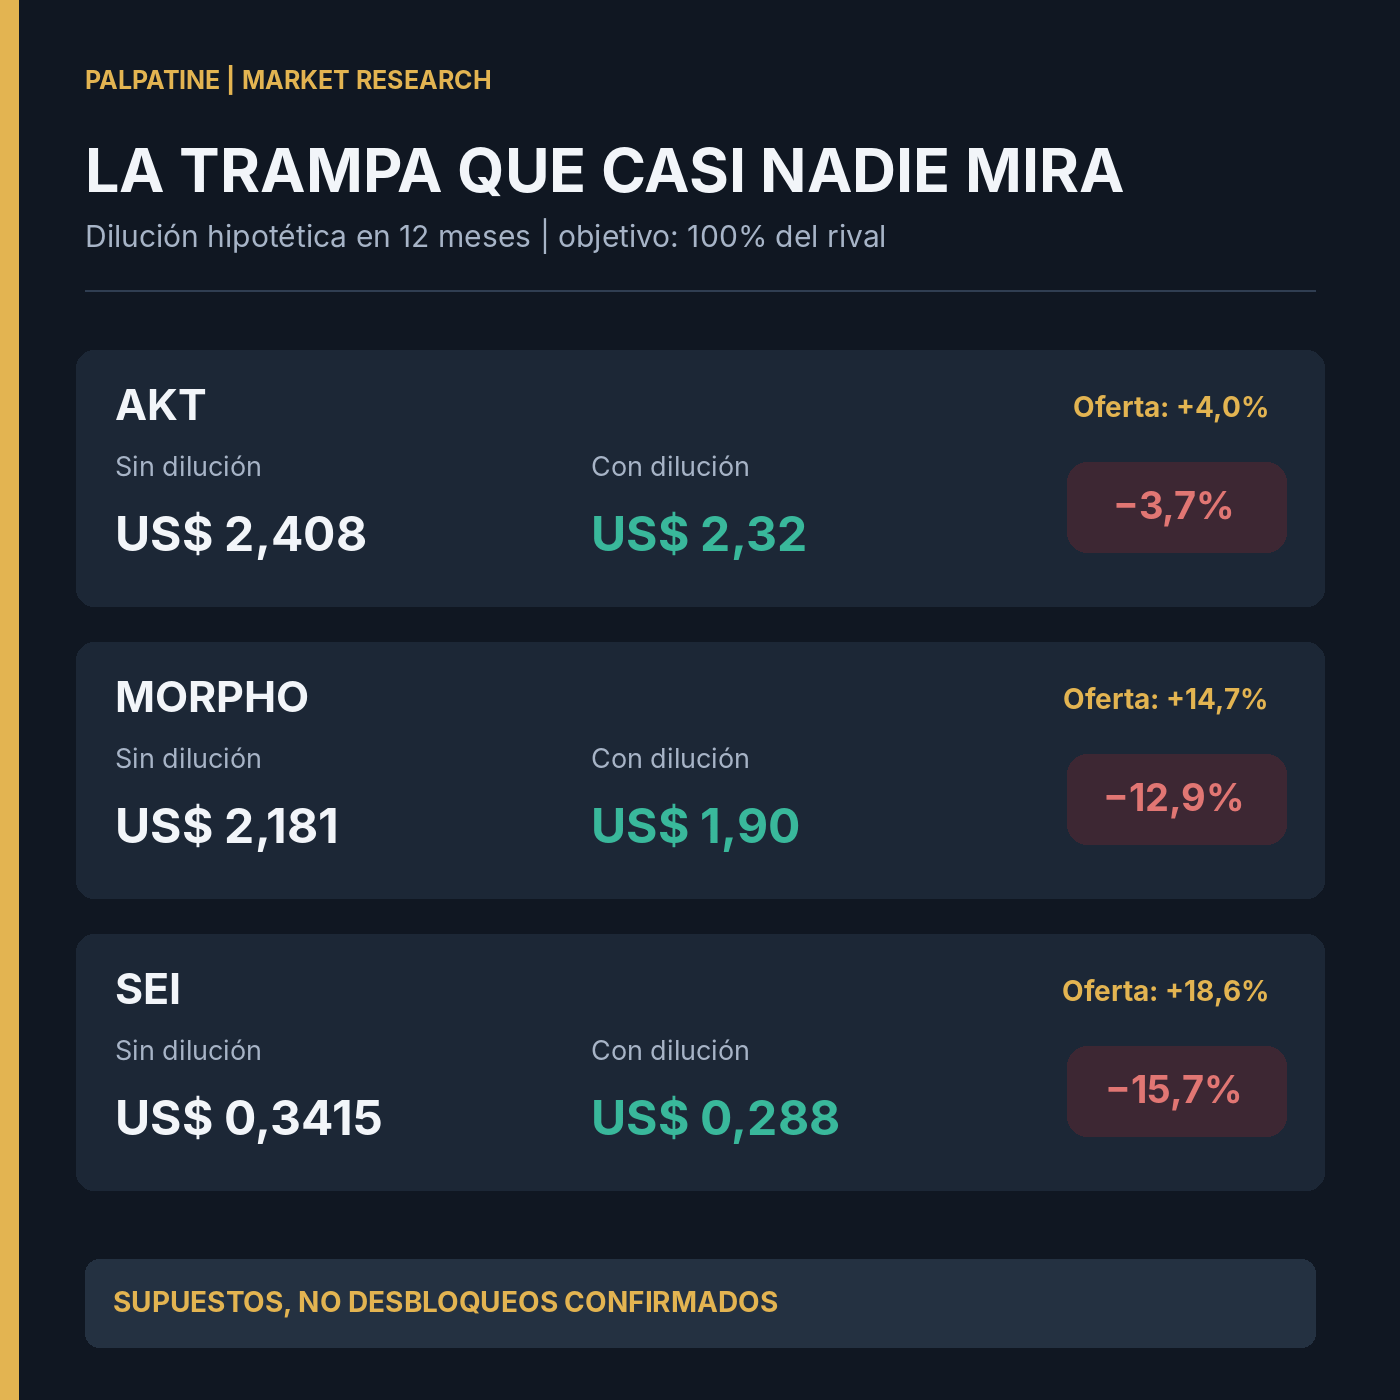
Infographic 3 · Palpatine Market Research · 21/11/2026
The result matters: MORPHO’s theoretical appreciation would fall from approximately 39% to 21% if it matched AAVE’s current value with that future supply. The difference is also substantial for SEI. These are arithmetic supply simulations, not guaranteed unlock schedules or price forecasts.
7. What should you watch before opening a position?
Three questions separate research from an impulsive bet:
Adoption: are users, activity, TVL, or commercial consumption growing faster than those of its competitors?
Value capture: does that growth generate real economic demand for the token, or does it only benefit the protocol or its ecosystem?
Supply: how much additional supply could enter the market in six or twelve months, and who might sell it?
And a fourth question about price: good fundamentals are not enough if the chart keeps making lower highs and lower lows. A long-term opportunity does not require buying today at any price.
8. Our watchlist ranking
🥇 AKT — 7/10: the best relative combination of size, potential business, and economic mechanism, with migration and adoption risks.
🥈 MORPHO — 5/10: considerable lending activity; less asymmetric valuation and a need for greater value capture for the token.
🥉 SEI — 4/10: potential for very substantial valuation convergence, but the usage gap and dilution are too significant to ignore.
The most important figure is not ×5 or ×10. It is knowing what needs to happen in the real world for that number to stop being an equation.
Which one do you see as a real opportunity, and which seems like a valuation trap: $AKT, $MORPHO, or $SEI?
Methodology: data snapshot as of 21/11/2026. Comparisons are based on circulating market cap and scenarios with constant or projected supply. The 7/10, 5/10, and 4/10 scores are qualitative ratings, not probabilities. Prices, flows, and on-chain metrics fluctuate and should be checked at the time of trading.