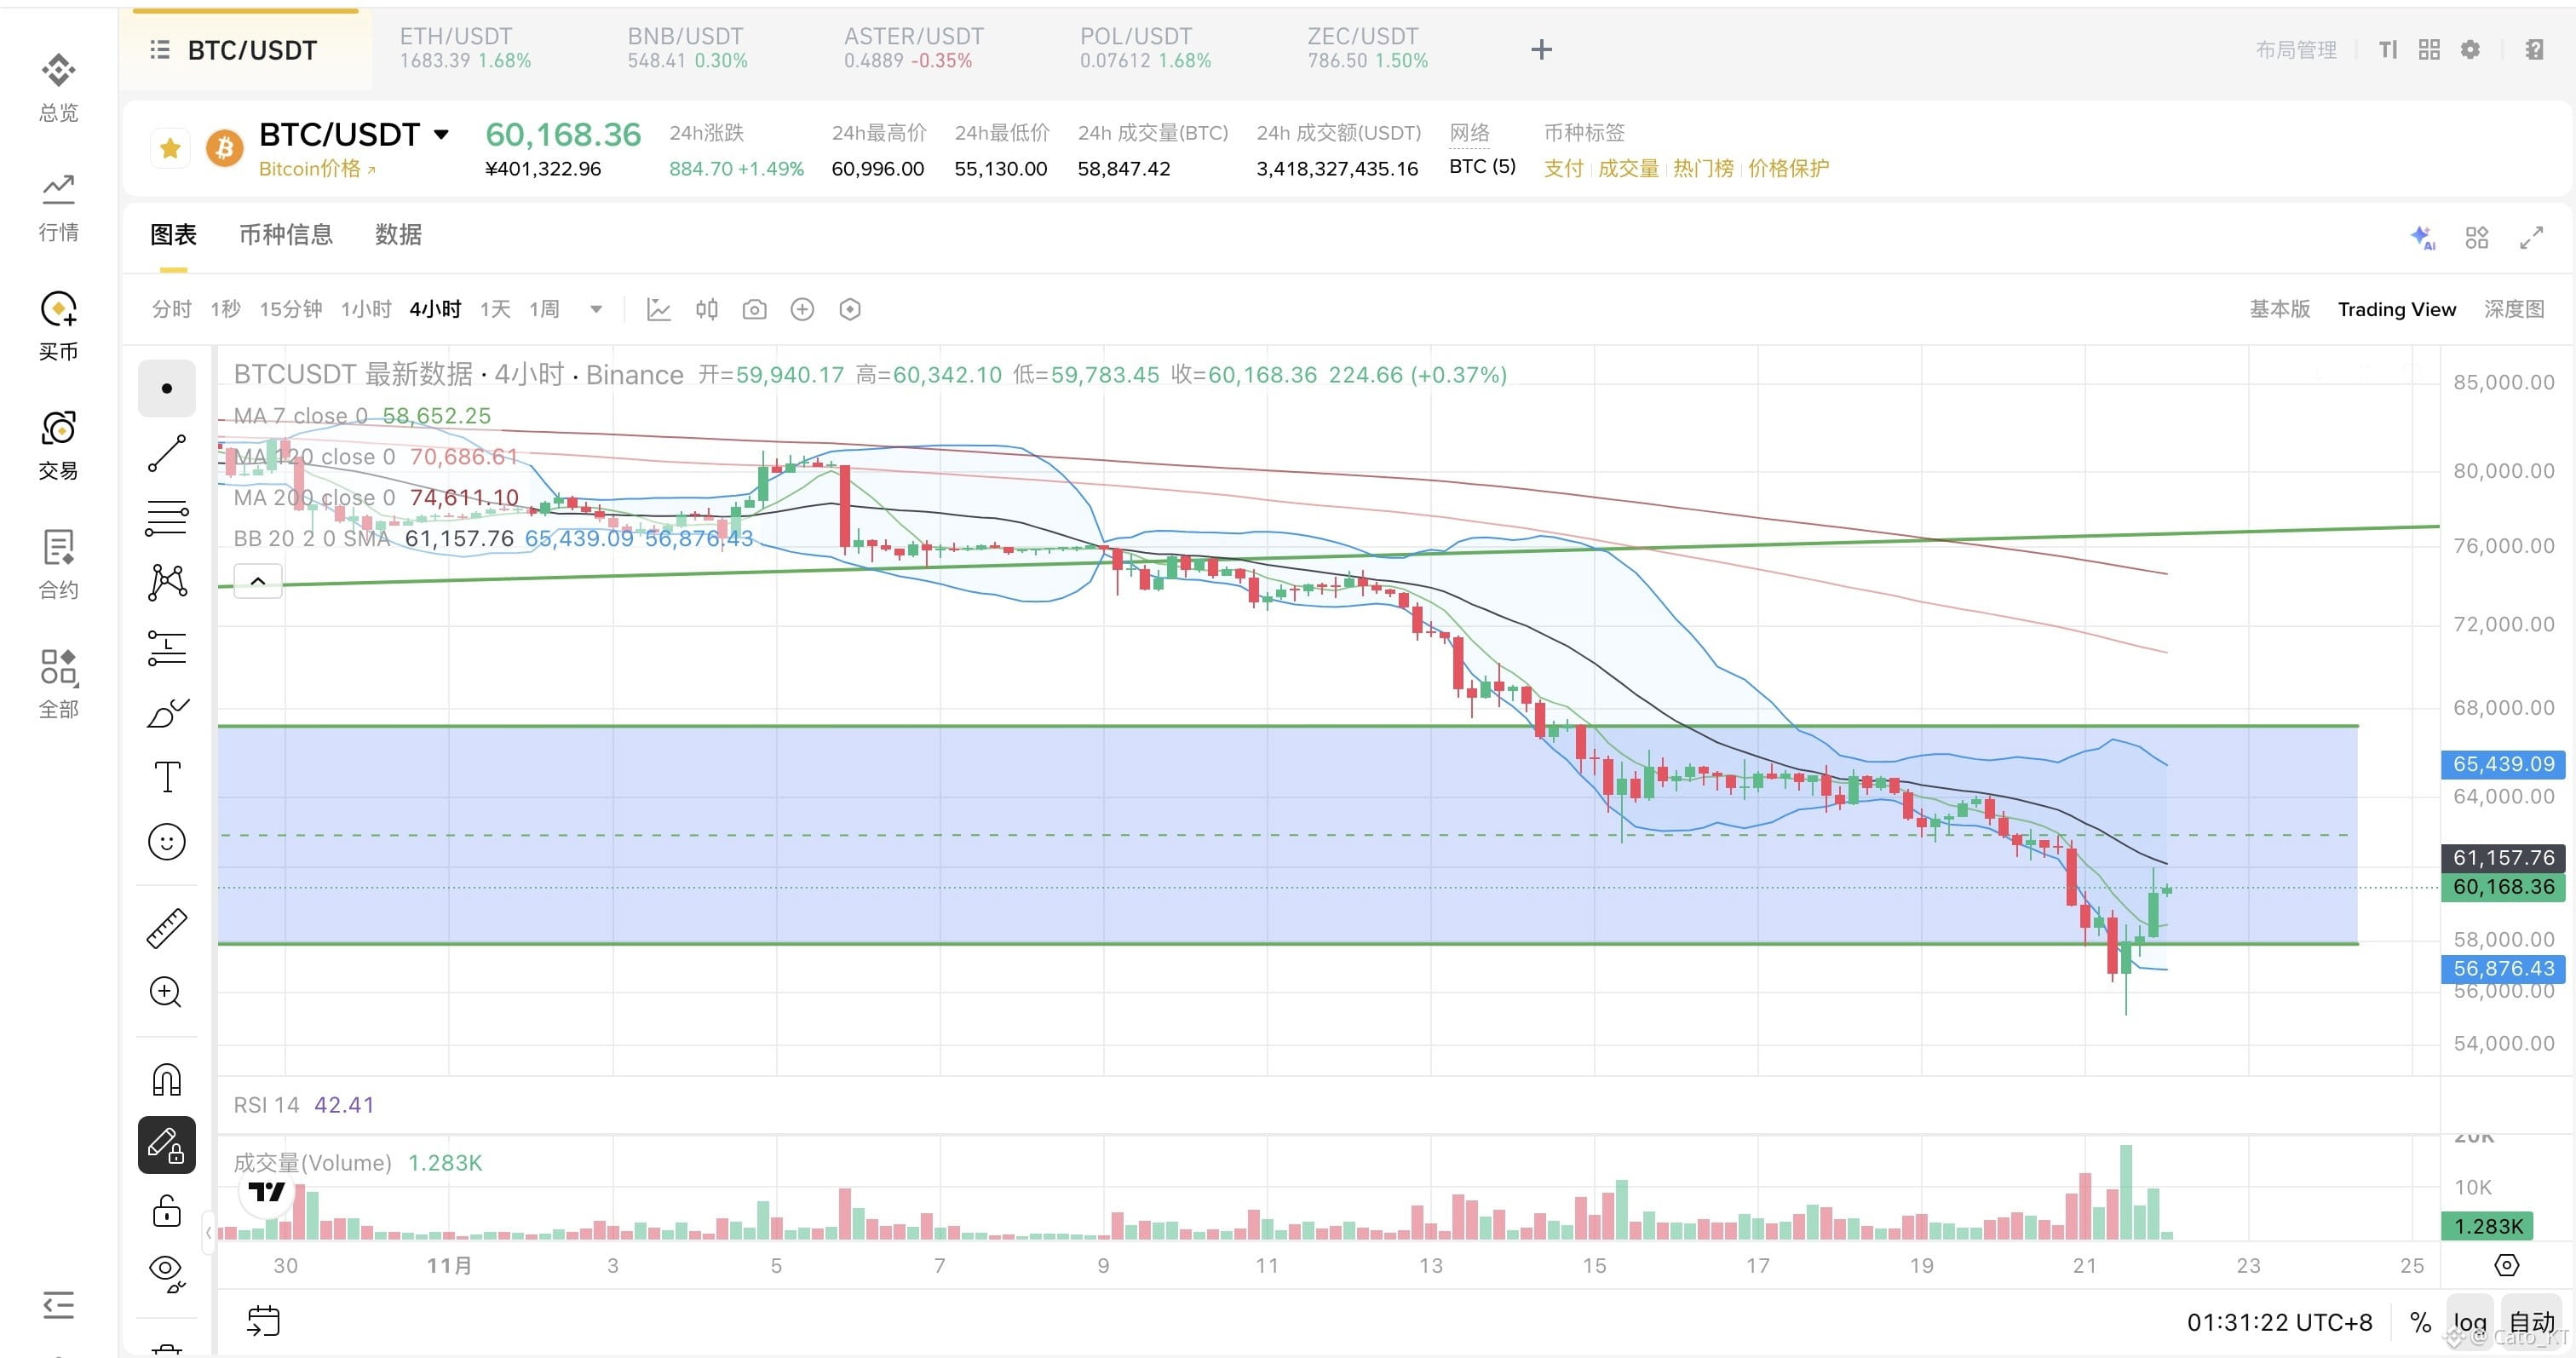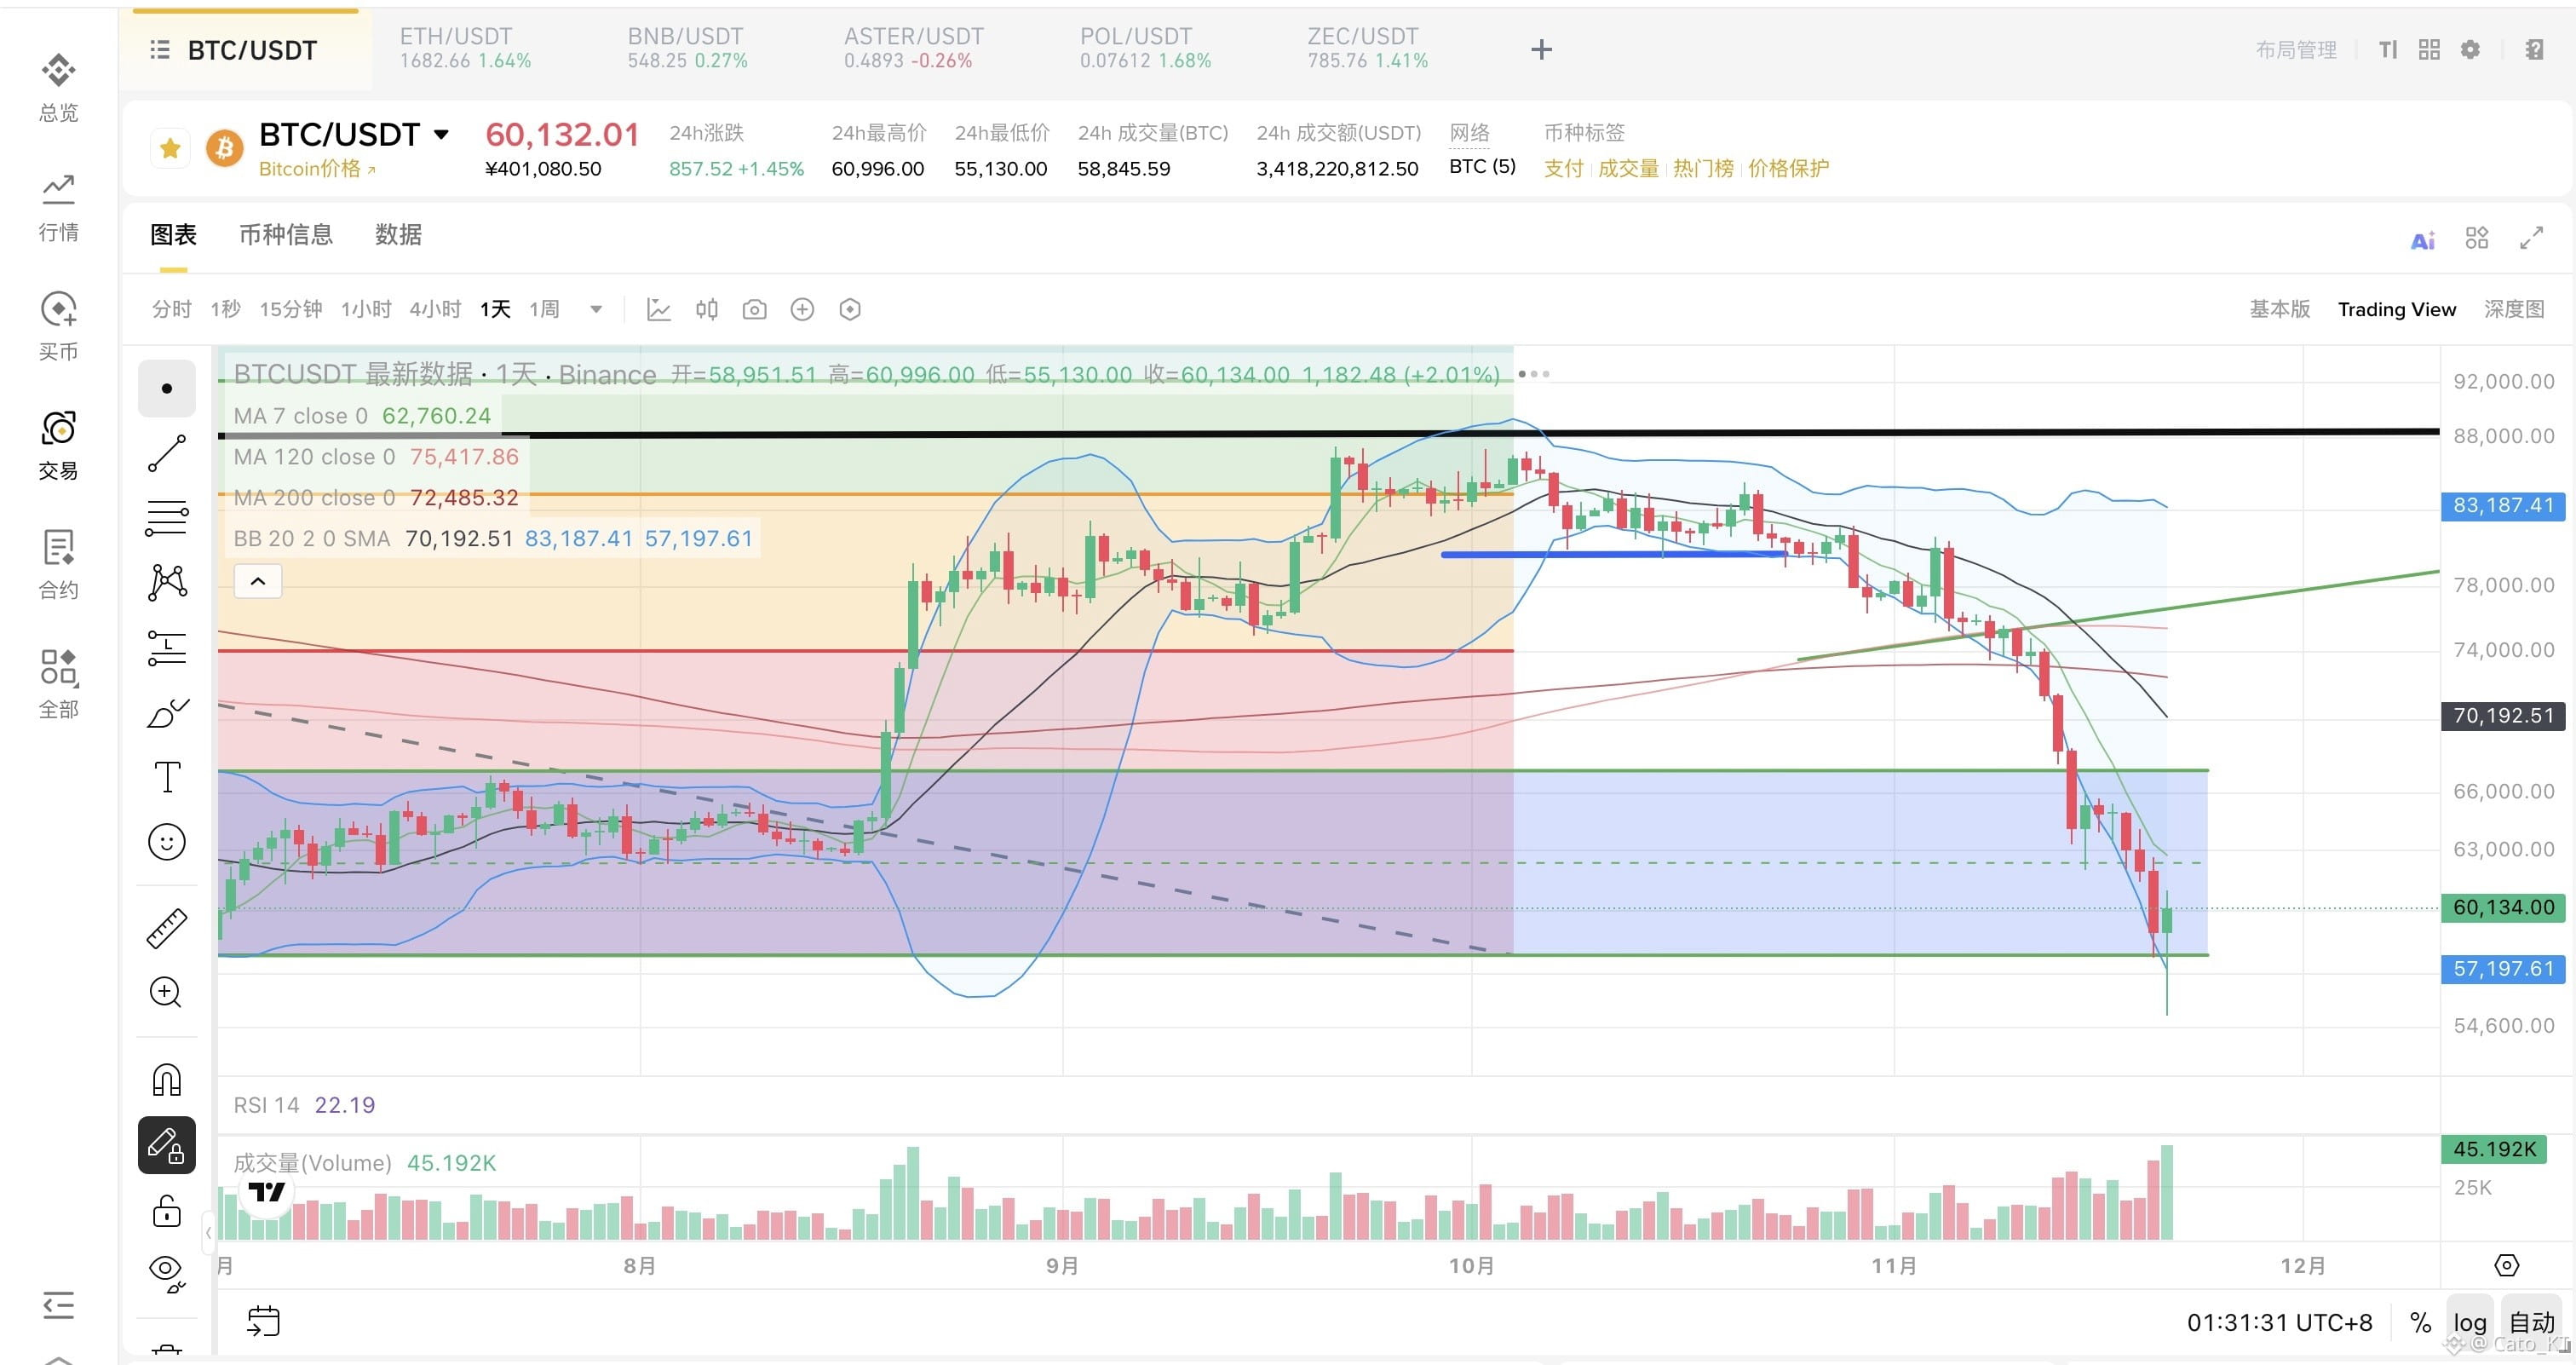
Taking another look at the #Bitcoin charts before bed—the weekend rebound is gaining strength, and signs of a bottom are becoming increasingly clear!
As mentioned in the previous post, from the 1-hour to the 4-hour chart, the price rebound has broken through resistance and held above it in the short term. It then continued to make new highs after a pullback. The short-term rebound has suddenly gained strength, and signs of a bottom on the hourly chart are becoming increasingly clear.
In this ideal scenario, if the daily chart continues to hold above 57,900 and the daily candles go on to make new highs after a pullback, then by next Monday the price could recover to above Friday’s bearish candle at 62,600. The daily chart would also see a strong rebound. As long as the price doesn’t make a new low afterward and forms a short-term consolidation range, signs of a bottom will become increasingly clear!
Of course, after yesterday’s “smooth” drop, many of you still feel uneasy about this strong rebound and worry it might be a false rally. That’s understandable, so we need to see whether the data supports this rebound.
First, let’s look at Friday’s ETF data. IBIT’s data for Friday hasn’t been released yet, so the figures are incomplete. The key is whether institutions increased their selling pressure on Friday. If net outflows continue to grow, Friday could be seen as an opportunity for institutional selling pressure to be fully flushed out.
Next, we’ll keep watching whether ETF net outflows continue to narrow next week, or even turn into sustained net inflows.
As for crypto market data, trading volume doubled compared with Friday. Clearly, this drop led to a large amount of turnover, with selling pressure being flushed out and buying activity picking up. That’s a good sign for the market. A sharp drop is less worrying than a slow decline that wears people down.
As for crypto fund flows, net outflows totaled 800 million before Friday’s drop, including 534 million in USDT outflows. USDC outflows were negligible. Compared with previous net outflows, the figures have narrowed somewhat.
For now, let’s keep waiting.
Let’s see whether the rebound continues to strengthen and makes the daily chart’s bottoming signal clearer; whether Friday’s ETF data shows that institutional selling pressure has been released; and whether Monday’s ETF data shows net outflows pausing and flows starting to return.
As for your concerns about a fake rebound or false breakout, trading volume in the crypto market suggests there’s no major issue for now. Whether you look at exchange volume charts or data from analytics sites, trading volume has indeed increased along with the rebound, so we can tentatively rule out a fake rebound and breakout!#比特币跌破6万美元,短期能否企稳反弹?
As mentioned in the previous post, from the 1-hour to the 4-hour chart, the price rebound has broken through resistance and held above it in the short term. It then continued to make new highs after a pullback. The short-term rebound has suddenly gained strength, and signs of a bottom on the hourly chart are becoming increasingly clear.
In this ideal scenario, if the daily chart continues to hold above 57,900 and the daily candles go on to make new highs after a pullback, then by next Monday the price could recover to above Friday’s bearish candle at 62,600. The daily chart would also see a strong rebound. As long as the price doesn’t make a new low afterward and forms a short-term consolidation range, signs of a bottom will become increasingly clear!
Of course, after yesterday’s “smooth” drop, many of you still feel uneasy about this strong rebound and worry it might be a false rally. That’s understandable, so we need to see whether the data supports this rebound.
First, let’s look at Friday’s ETF data. IBIT’s data for Friday hasn’t been released yet, so the figures are incomplete. The key is whether institutions increased their selling pressure on Friday. If net outflows continue to grow, Friday could be seen as an opportunity for institutional selling pressure to be fully flushed out.
Next, we’ll keep watching whether ETF net outflows continue to narrow next week, or even turn into sustained net inflows.
As for crypto market data, trading volume doubled compared with Friday. Clearly, this drop led to a large amount of turnover, with selling pressure being flushed out and buying activity picking up. That’s a good sign for the market. A sharp drop is less worrying than a slow decline that wears people down.
As for crypto fund flows, net outflows totaled 800 million before Friday’s drop, including 534 million in USDT outflows. USDC outflows were negligible. Compared with previous net outflows, the figures have narrowed somewhat.
For now, let’s keep waiting.
Let’s see whether the rebound continues to strengthen and makes the daily chart’s bottoming signal clearer; whether Friday’s ETF data shows that institutional selling pressure has been released; and whether Monday’s ETF data shows net outflows pausing and flows starting to return.
As for your concerns about a fake rebound or false breakout, trading volume in the crypto market suggests there’s no major issue for now. Whether you look at exchange volume charts or data from analytics sites, trading volume has indeed increased along with the rebound, so we can tentatively rule out a fake rebound and breakout!#比特币跌破6万美元,短期能否企稳反弹?