$ETH Crypto Academician: 11.22 Ethereum (ETH): Can a lower wick save the trend? The bearish moving-average alignment remains intact, while oversold momentum fades!
I’ve mentioned 1650 as the first step for spot positioning for several days in a row; the second step at 1550 has also been reached. The first mid- to long-term target is above 3000. It doesn’t matter how long we hold—this is capital we can afford to lose anyway. I tried going long with contracts five or six times and got stopped out. Fortunately, I always leave myself room to be wrong: if my call is wrong, I take a small loss and get out; if it’s right, I let profits run. Given enough time, you naturally stay in the game. For contracts opened long below 1650, the mid- to long-term liquidation price is below 1000. The first target is the 1830–1940 range, and the second target is 2400–2500, where positions can be reduced in batches. The short-term trend is naturally bearish; for intraday trading, the focus remains on shorting from higher levels.
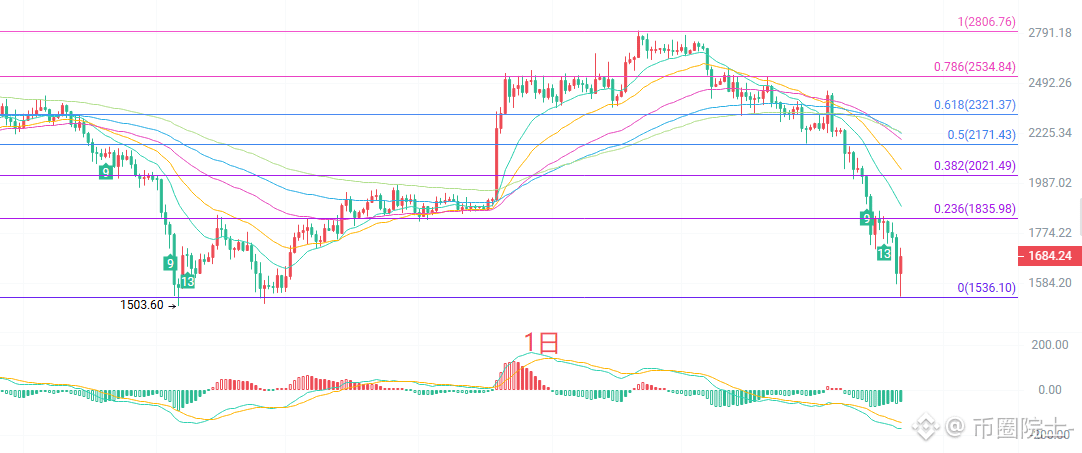
The daily candlestick closed as a bullish rebound candle with a lower wick. Structurally, since retreating from the previous high of 2806, the moving averages have formed a typical bearish alignment: all EMAs are above the current price, and the medium-term trend remains bearish. As for indicators, MACD is below the zero line, and momentum has yet to turn around. The Bollinger Bands’ lower band is at 1549, the middle band at 2003, and the upper band at 2457. After tracking along the lower band, the price rebounded. 1536 coincides with this retracement’s low, and buyers have stepped in here in the short term. But to confirm a bottom, the price needs to reclaim at least the 1835–0.236 area first; otherwise, this should still be treated as a rebound after a decline.
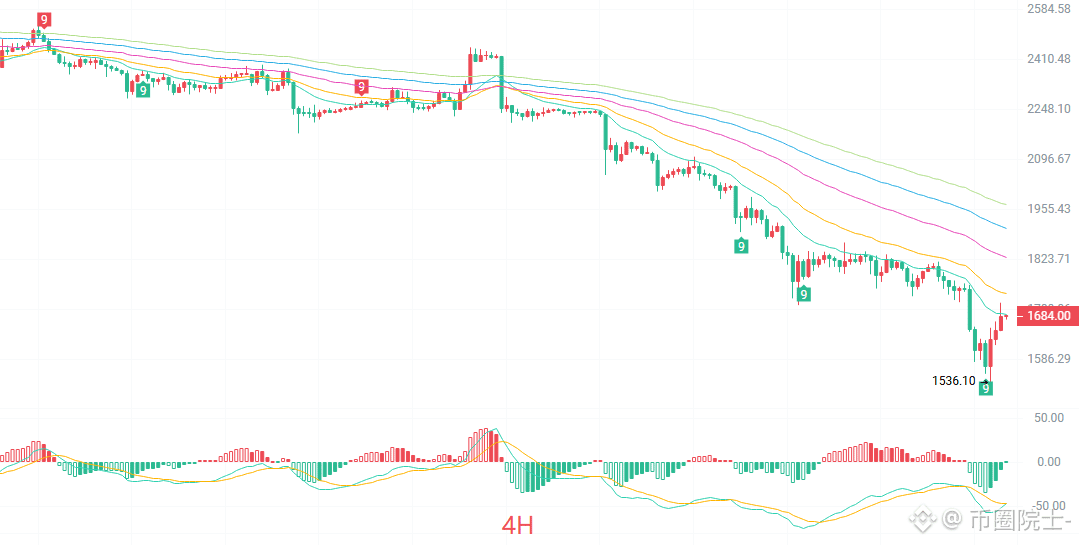
The four-hour chart shows a narrow consolidation after a sharp drop. The moving averages are at: EMA15 1689, EMA30 1738, EMA60 1827, EMA90 1904, and EMA120 1968. The short- and medium-term averages remain stacked overhead, pressing down on the price, which is currently just below EMA15. The MACD histogram’s green bars continue to shorten, indicating that short-term selling pressure is easing and suggesting a possible attempt to stabilize. The Bollinger Bands’ lower band is at 1575, the middle band at 1717, and the upper band at 1859. The price has rebounded from near the lower band but is still trading below the middle band. The TD count is at 3, so the rebound structure is still in its early stages. Overall, this is a weak recovery after becoming oversold. The 1675 area is the short-term bull-bear divide, while the 1718 middle band is the first hurdle. If the price cannot break above it, the market will remain range-bound with a bearish bias. These levels can serve as reference points for short and long positions.
Short-term levels:
Short: 1720–1750, where upward momentum stalls; stop-loss 30 points; target 1680–1650.
Long: 1650–1620, where the decline stabilizes; stop-loss 30 points; target 1700–1750.
For specific trades, follow real-time order-book data. For more information, please contact the author.
#ETH走势分析
I’ve mentioned 1650 as the first step for spot positioning for several days in a row; the second step at 1550 has also been reached. The first mid- to long-term target is above 3000. It doesn’t matter how long we hold—this is capital we can afford to lose anyway. I tried going long with contracts five or six times and got stopped out. Fortunately, I always leave myself room to be wrong: if my call is wrong, I take a small loss and get out; if it’s right, I let profits run. Given enough time, you naturally stay in the game. For contracts opened long below 1650, the mid- to long-term liquidation price is below 1000. The first target is the 1830–1940 range, and the second target is 2400–2500, where positions can be reduced in batches. The short-term trend is naturally bearish; for intraday trading, the focus remains on shorting from higher levels.
The daily candlestick closed as a bullish rebound candle with a lower wick. Structurally, since retreating from the previous high of 2806, the moving averages have formed a typical bearish alignment: all EMAs are above the current price, and the medium-term trend remains bearish. As for indicators, MACD is below the zero line, and momentum has yet to turn around. The Bollinger Bands’ lower band is at 1549, the middle band at 2003, and the upper band at 2457. After tracking along the lower band, the price rebounded. 1536 coincides with this retracement’s low, and buyers have stepped in here in the short term. But to confirm a bottom, the price needs to reclaim at least the 1835–0.236 area first; otherwise, this should still be treated as a rebound after a decline.
The four-hour chart shows a narrow consolidation after a sharp drop. The moving averages are at: EMA15 1689, EMA30 1738, EMA60 1827, EMA90 1904, and EMA120 1968. The short- and medium-term averages remain stacked overhead, pressing down on the price, which is currently just below EMA15. The MACD histogram’s green bars continue to shorten, indicating that short-term selling pressure is easing and suggesting a possible attempt to stabilize. The Bollinger Bands’ lower band is at 1575, the middle band at 1717, and the upper band at 1859. The price has rebounded from near the lower band but is still trading below the middle band. The TD count is at 3, so the rebound structure is still in its early stages. Overall, this is a weak recovery after becoming oversold. The 1675 area is the short-term bull-bear divide, while the 1718 middle band is the first hurdle. If the price cannot break above it, the market will remain range-bound with a bearish bias. These levels can serve as reference points for short and long positions.
Short-term levels:
Short: 1720–1750, where upward momentum stalls; stop-loss 30 points; target 1680–1650.
Long: 1650–1620, where the decline stabilizes; stop-loss 30 points; target 1700–1750.
For specific trades, follow real-time order-book data. For more information, please contact the author.
#ETH走势分析