$BTC Crypto Academician: 11.22 The truth behind Bitcoin (BTC)’s four-hour winning streak: Signs of stabilization have appeared, but what step is still missing before the MACD golden cross turns positive?
I took out 50% of my coffin money and put it into spot Bitcoin, then used the idle funds left over to trade contracts. Market fear has now fallen below 10. Many crypto friends see an opportunity, but have no coins left to buy. The market makers gave those hoping to buy the dip with leverage no chance: after testing the bottom at 55,000, the price quickly rebounded by more than 5,000 points. Of course, a rebound does not mean a reversal, and sideways movement does not necessarily mean a bottom is forming. For the medium term, the first target for a move north before year-end is around 65,000; the second target is 73,500–75,000, where positions can be exited in batches. My intraday outlook remains bearish.
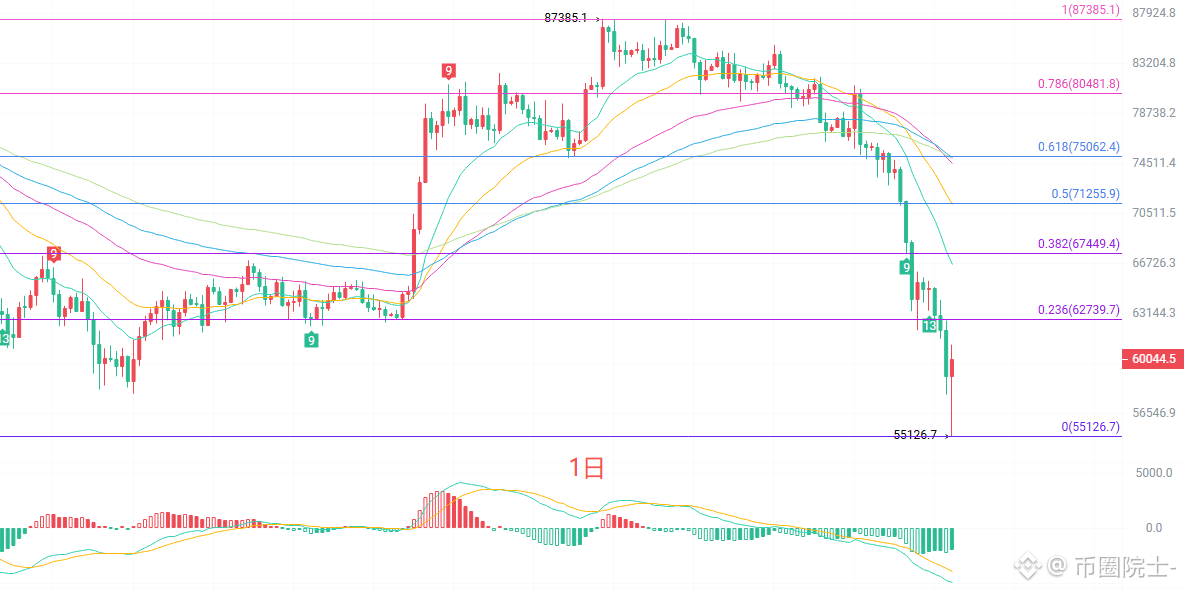
The daily candlestick is a rebound candle with a lower wick following a sharp decline. As for the moving averages, EMA15 is at 66665, EMA30 at 71210, EMA60 at 74531, EMA90 at 75039, and EMA120 at 74958. The current price is well below all short- and medium-term moving averages, a typical bearish alignment, so any rebound will first face layers of moving-average resistance. The MACD lines are below the zero line, and the green bars are still growing, so trend momentum has not yet turned around. The Bollinger middle band is at 70154, the upper band at 83170, and the lower band at 57137; the price is trading close to the lower band. The 0.236 Fibonacci retracement level is around 62739, serving as the first resistance to a rebound. Overall, the daily chart remains weak; a one-day rebound is better understood as an oversold recovery, and a bottom has yet to be confirmed.
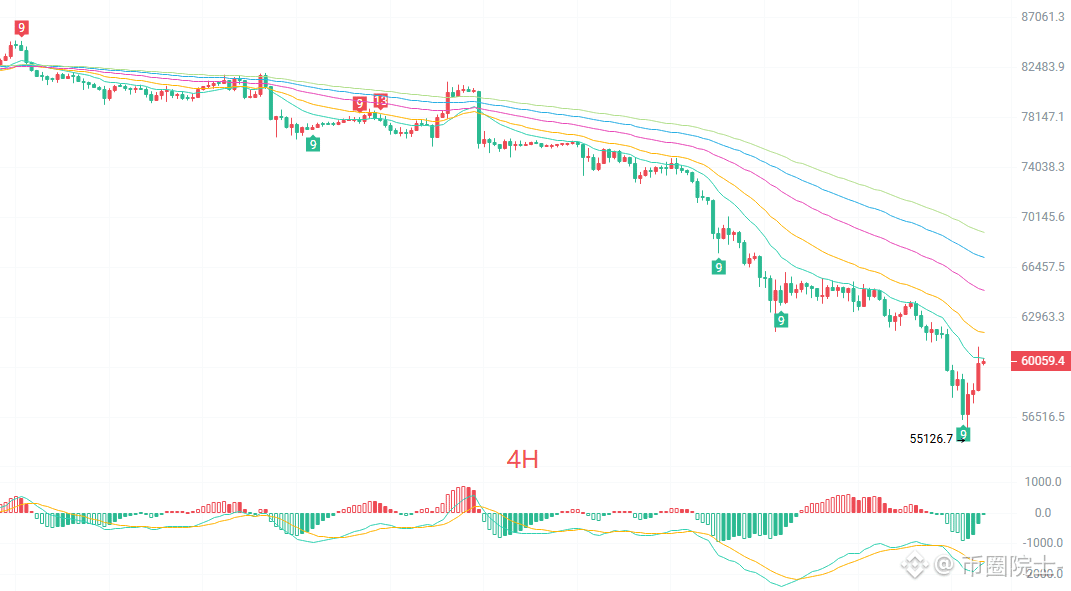
On the four-hour chart, several rebound candles have formed after the low of 55126, showing signs of short-term stabilization, though the momentum is limited. EMA15 is at 60238, just above the current price, making it the first moving-average resistance. EMA30 is at 61915, EMA60 at 64819, EMA90 at 67153, and EMA120 at 68997. The medium- and long-term moving averages are still diverging downward, so the bearish structure remains unchanged. The MACD lines are below the zero line, while the green bars have shortened noticeably, indicating that downward momentum is fading, but there has not yet been a golden cross or a shift to positive bars. The Bollinger middle band is at 61120, the upper band at 65413, and the lower band at 56826. The price has rebounded from near the lower band, suggesting short-term sideways recovery. For the four-hour chart to turn stronger, the price must first rise above EMA15 and then break through the 61120 middle band. If it cannot, the rebound may still be pushed back down.
Short-term reference:
Short: enter between 60700 and 60200 if upward momentum stalls; stop-loss 500 points; target 59000–57500
Long: enter between 57000 and 56000 if the decline finds support; stop-loss 500 points; target 59500–60500
For specific trades, prioritize real-time order book data
#BTC走势分析
I took out 50% of my coffin money and put it into spot Bitcoin, then used the idle funds left over to trade contracts. Market fear has now fallen below 10. Many crypto friends see an opportunity, but have no coins left to buy. The market makers gave those hoping to buy the dip with leverage no chance: after testing the bottom at 55,000, the price quickly rebounded by more than 5,000 points. Of course, a rebound does not mean a reversal, and sideways movement does not necessarily mean a bottom is forming. For the medium term, the first target for a move north before year-end is around 65,000; the second target is 73,500–75,000, where positions can be exited in batches. My intraday outlook remains bearish.
The daily candlestick is a rebound candle with a lower wick following a sharp decline. As for the moving averages, EMA15 is at 66665, EMA30 at 71210, EMA60 at 74531, EMA90 at 75039, and EMA120 at 74958. The current price is well below all short- and medium-term moving averages, a typical bearish alignment, so any rebound will first face layers of moving-average resistance. The MACD lines are below the zero line, and the green bars are still growing, so trend momentum has not yet turned around. The Bollinger middle band is at 70154, the upper band at 83170, and the lower band at 57137; the price is trading close to the lower band. The 0.236 Fibonacci retracement level is around 62739, serving as the first resistance to a rebound. Overall, the daily chart remains weak; a one-day rebound is better understood as an oversold recovery, and a bottom has yet to be confirmed.
On the four-hour chart, several rebound candles have formed after the low of 55126, showing signs of short-term stabilization, though the momentum is limited. EMA15 is at 60238, just above the current price, making it the first moving-average resistance. EMA30 is at 61915, EMA60 at 64819, EMA90 at 67153, and EMA120 at 68997. The medium- and long-term moving averages are still diverging downward, so the bearish structure remains unchanged. The MACD lines are below the zero line, while the green bars have shortened noticeably, indicating that downward momentum is fading, but there has not yet been a golden cross or a shift to positive bars. The Bollinger middle band is at 61120, the upper band at 65413, and the lower band at 56826. The price has rebounded from near the lower band, suggesting short-term sideways recovery. For the four-hour chart to turn stronger, the price must first rise above EMA15 and then break through the 61120 middle band. If it cannot, the rebound may still be pushed back down.
Short-term reference:
Short: enter between 60700 and 60200 if upward momentum stalls; stop-loss 500 points; target 59000–57500
Long: enter between 57000 and 56000 if the decline finds support; stop-loss 500 points; target 59500–60500
For specific trades, prioritize real-time order book data
#BTC走势分析