

When the market comes under pressure and breaks key levels, it’s natural for alarmist voices to grow louder and for everyone to throw out worst-case scenarios.
But if we read the numbers and the chart calmly and logically, let’s look at what’s actually happening beneath the surface:
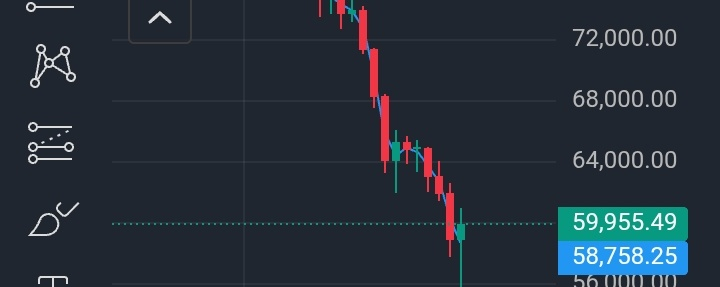
Bitcoin tested levels below $60,000 (reaching close to $56,000 before stabilizing around $59,000).
This drop cleared out large clusters of leveraged contracts (liquidating long positions between $59,000 and $62,000), mechanically removing much of the forced selling pressure that had been hanging over the market.
The main reason for the pressure isn’t the end of crypto; it’s a temporary contraction in liquidity from two sources: gradual outflows from spot investment funds during November (around $3.4 billion), and a decline of roughly $14–16 billion in the market’s stablecoin supply over the past month
Put simply, there’s a little less cash ready for quick buying, amid market caution and interest rate expectations
Despite this month’s temporary outflows, institutional funds still hold huge positive net inflows since their launch, exceeding $53 billion. The liquidation of excess leverage is cleaning the market of random speculation and making the next move cleaner and more realistic
Bitcoin is once again proving today that it’s an asset driven by liquidity before anything else. The alarmism during a downturn changes nothing, and the chart is currently searching for a new equilibrium base after leveraged positions were wiped out
I think any genuine, sustained rebound will begin when we see the stablecoin supply stabilize and the funds’ outflows stop—not before
At stages like these, staying calm and managing risk matter more than chasing every red or green candle