#ONE/USDT
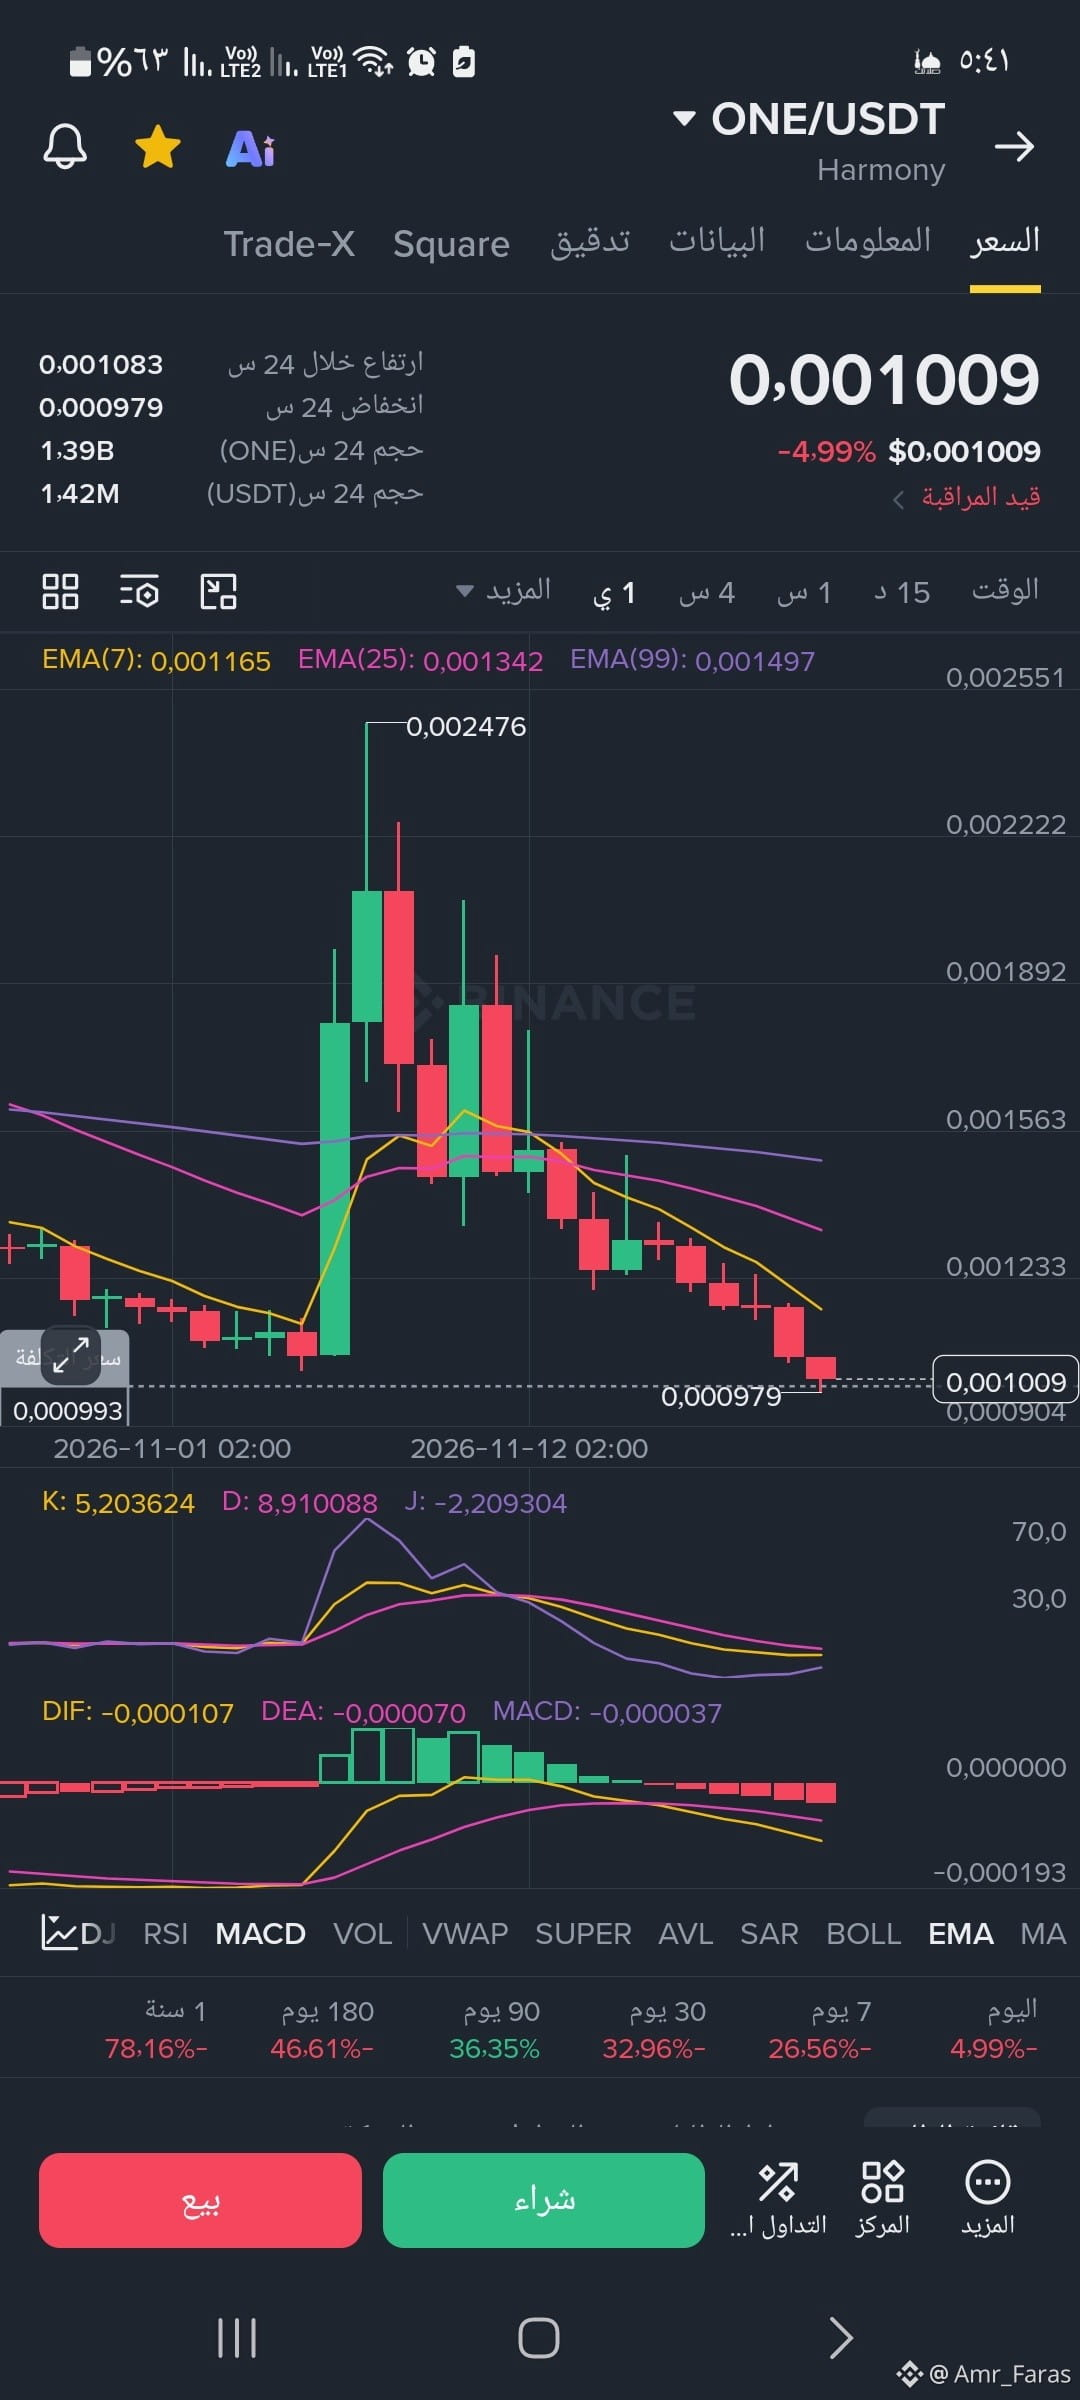
Reading the data and technical indicators in the image:
• Current price and daily movement. The pair is trading at $0.001009, down 4.99% over the last 24 hours.
• Trading range (24 hours). The price reached a high of 0.001083 and a low of 0.000979 (a current support level being tested by the price).
• Moving averages (EMA). The price is currently trading below all major moving averages (EMA7 at 0.001165, EMA25 at 0.001342, and EMA99 at 0.001497), reflecting the dominance of a downtrend in the short and medium term.
• KDJ indicator. It is in deeply oversold territory (K value of 5.20 and a negative J value of -2.20), which often indicates that selling momentum is exhausted and a technical rebound may occur soon, although no confirmed bullish crossover signal has appeared yet.
• MACD indicator. The indicator lines (DIF and DEA) are below zero and moving downward, with negative red bars, confirming that selling momentum is continuing.
Reading the data and technical indicators in the image:
• Current price and daily movement. The pair is trading at $0.001009, down 4.99% over the last 24 hours.
• Trading range (24 hours). The price reached a high of 0.001083 and a low of 0.000979 (a current support level being tested by the price).
• Moving averages (EMA). The price is currently trading below all major moving averages (EMA7 at 0.001165, EMA25 at 0.001342, and EMA99 at 0.001497), reflecting the dominance of a downtrend in the short and medium term.
• KDJ indicator. It is in deeply oversold territory (K value of 5.20 and a negative J value of -2.20), which often indicates that selling momentum is exhausted and a technical rebound may occur soon, although no confirmed bullish crossover signal has appeared yet.
• MACD indicator. The indicator lines (DIF and DEA) are below zero and moving downward, with negative red bars, confirming that selling momentum is continuing.