$SPCXB 🟢📊
Is SPCXBUSDT about to break through a key resistance level? An unfiltered look at the technical behavior ⚡
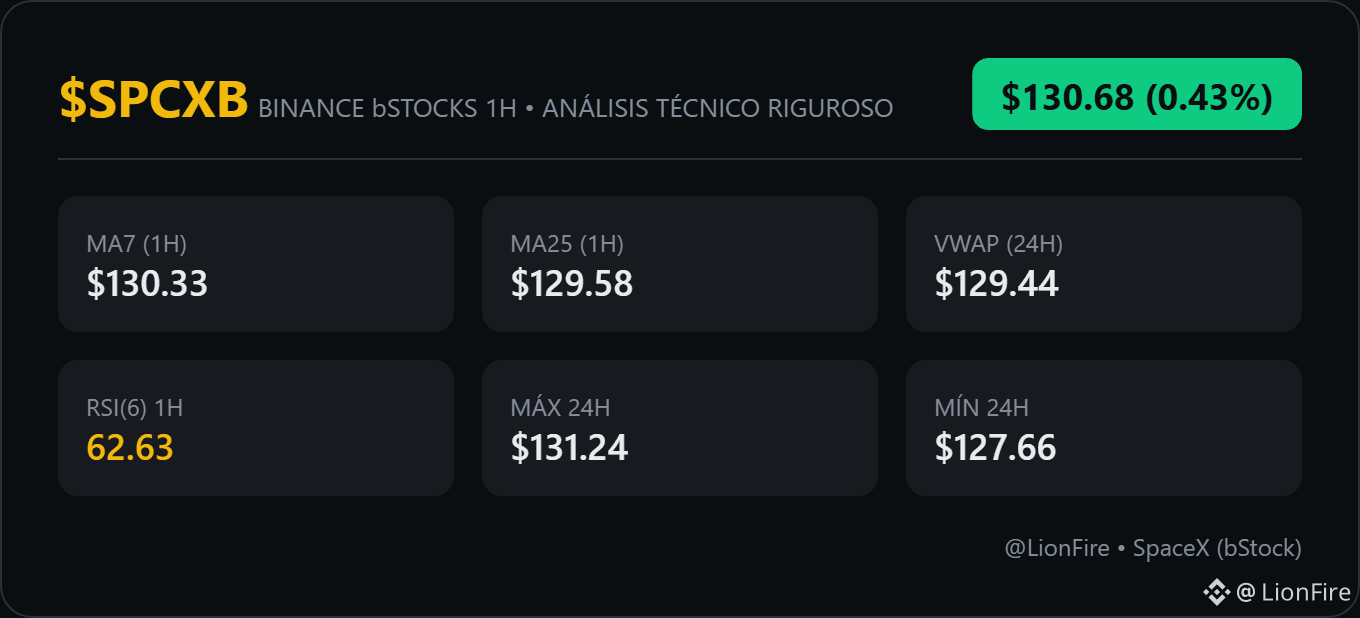
With $SPCXB trading at $130.68, very close to the 7-day moving average ($130.33), the market suggests possible consolidation or an upward breakout. The 1-hour RSI(6) at 62.63 indicates a balance between buyers and sellers, with potential for a significant technical move.
📊 1. Technical overview:
🟢 The price is above the MA7 ($130.33), the MA25 ($129.58), and the 24h VWAP ($129.44).
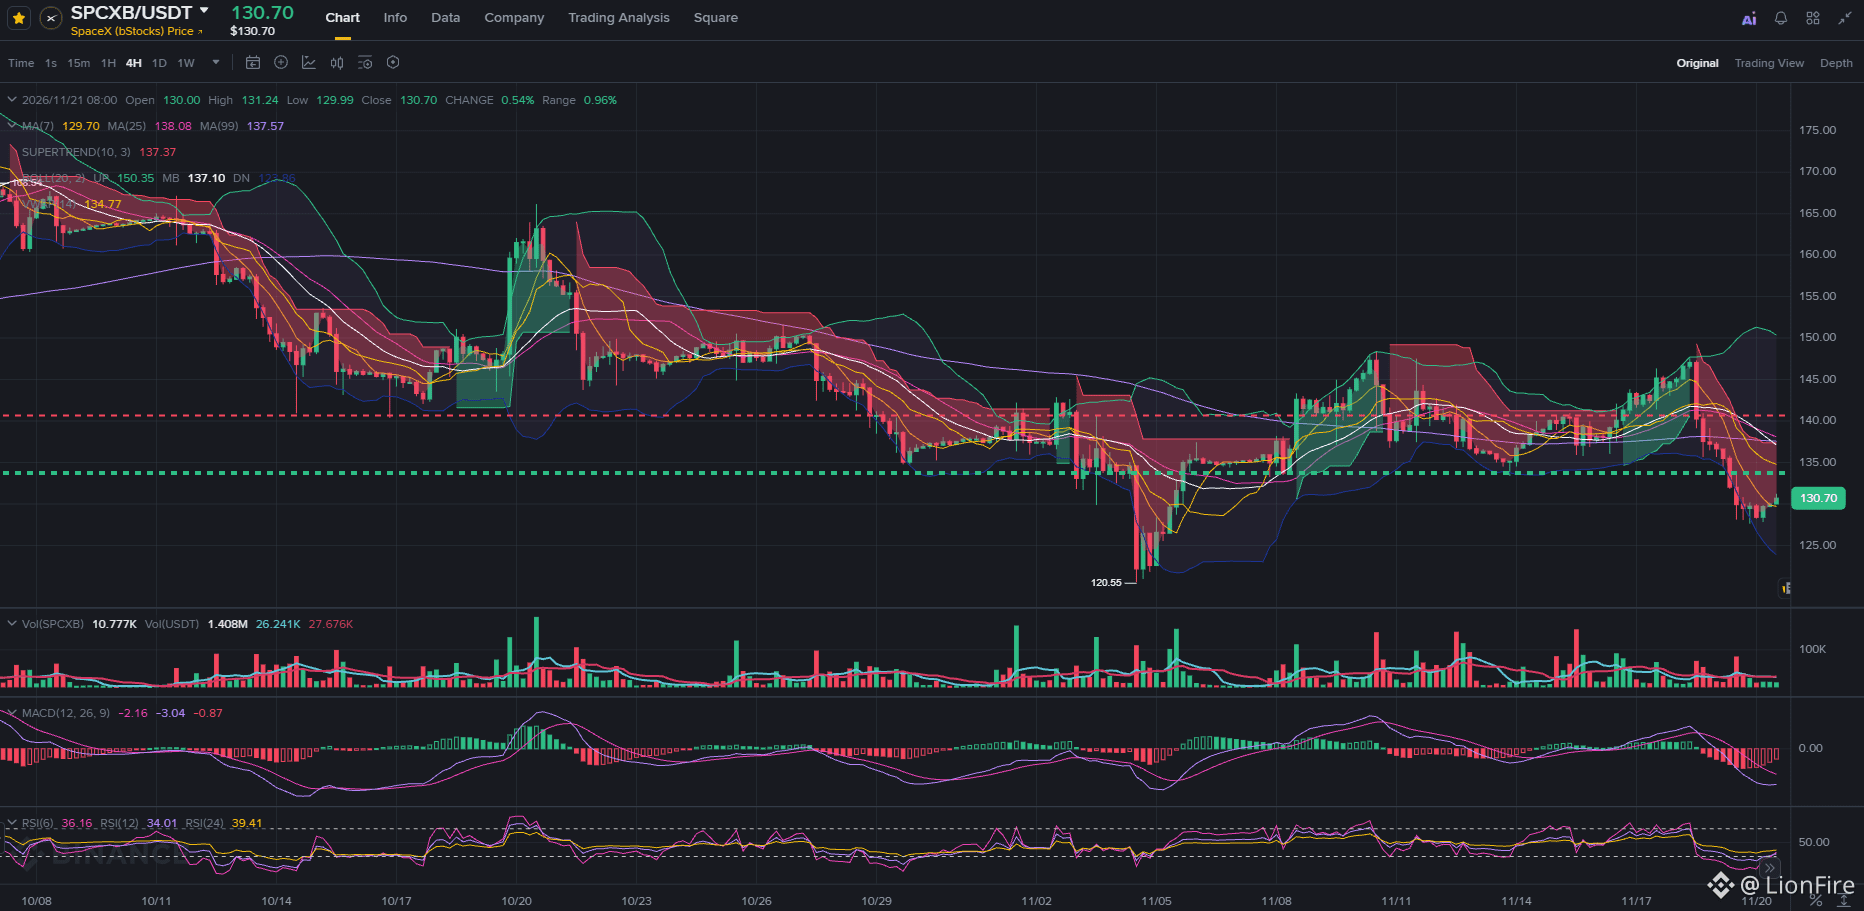
⚖️ The 1-hour chart structure shows a clear uptrend, with solid support at $127.66.
⚡ The RSI(6) at 62.63 suggests that buying momentum is healthy, with no imminent overbought signals.
⚠️ 2. Structural risk:
Although the current consolidation looks favorable, the proximity to the 24h high resistance ($131.24) creates significant technical tension. If volume does not confirm a clear breakout, unexpected pullbacks could occur.
💡
$SPCXB is in a favorable position to continue rising, but beware of FOMO euphoria and chasing green candles without a plan. Keep a cool head and don't let emotion lead you to make impulsive decisions.
#bStocks #CryptoAnalysis #SPCXB
Is SPCXBUSDT about to break through a key resistance level? An unfiltered look at the technical behavior ⚡
With $SPCXB trading at $130.68, very close to the 7-day moving average ($130.33), the market suggests possible consolidation or an upward breakout. The 1-hour RSI(6) at 62.63 indicates a balance between buyers and sellers, with potential for a significant technical move.
📊 1. Technical overview:
🟢 The price is above the MA7 ($130.33), the MA25 ($129.58), and the 24h VWAP ($129.44).
⚖️ The 1-hour chart structure shows a clear uptrend, with solid support at $127.66.
⚡ The RSI(6) at 62.63 suggests that buying momentum is healthy, with no imminent overbought signals.
⚠️ 2. Structural risk:
Although the current consolidation looks favorable, the proximity to the 24h high resistance ($131.24) creates significant technical tension. If volume does not confirm a clear breakout, unexpected pullbacks could occur.
💡
$SPCXB is in a favorable position to continue rising, but beware of FOMO euphoria and chasing green candles without a plan. Keep a cool head and don't let emotion lead you to make impulsive decisions.
#bStocks #CryptoAnalysis #SPCXB