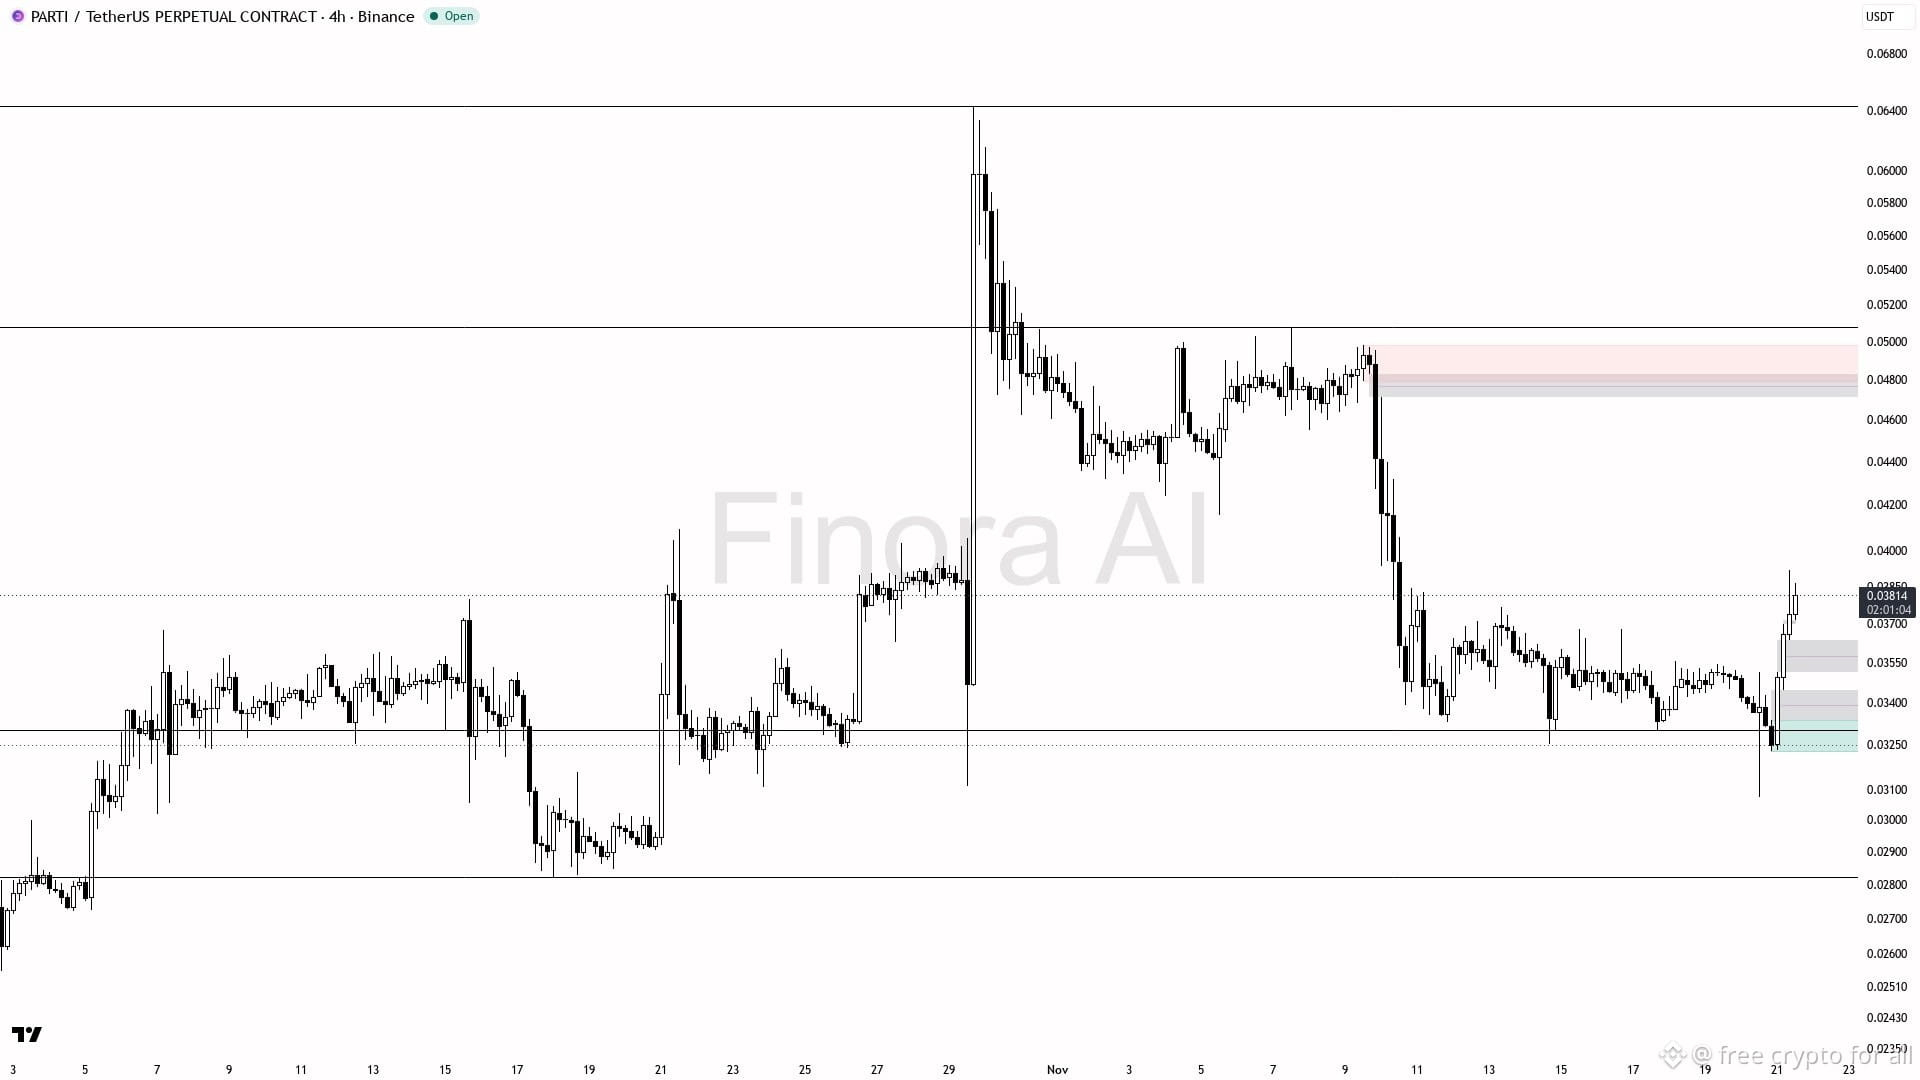
*PARTI / USDT Perpetual - 4H - Binance*
Current price on your chart: *∼0.03814 USDT*
Live price right now: *∼0.0383 USDT, +18.5% in 24h* - Open 0.0324, High 0.0393, Low 0.0309 5f12
What the chart is telling
*1. Big picture = Still Downtrend*
- Top was around *0.06400* on 29 Oct - sharp pump and dump
- After that price made lower highs all the way down
- On 9-10 Nov, it broke down hard from *0.04900* to *0.03300* in one move. That 0.049 level was the major breakdown point.
*2. Then 10 days of sideways / accumulation*
- From 10 Nov to 20 Nov, price was stuck in a tight range:
- *Support: 0.0325 - 0.0330*
- *Resistance: 0.0350 - 0.0355*
- It tested the 0.0325 support 3-4 times and held. That is why it didn't fall further.
*3. Now = Breakout attempt*
- Last 2 candles on your chart: strong green move from 0.0325 straight to 0.03814
- This is a breakout above the 0.0355 range high.
- On 1H and 4H, structure has turned bullish, but on Daily it is still bearish a53f
Key Levels to Watch
Level Type
**0.0325 - 0.0330** Major Support / Flip level - 4H close below this turns it bearish again
**0.0350 - 0.0355** Old resistance, now should act as support
**0.0380 - 0.0393** Current resistance / Today's high
**0.0440 - 0.0480** Next major resistance zone
**0.0490 - 0.0500** Breakdown zone - very heavy supply, the red box on your chart
My Read
- *If price holds above 0.0355 on 4H close:* Bullish continuation is open towards 0.0440, then 0.0480. The move has momentum.
- *If price falls back below 0.0355:* This breakout was a fakeout / trap, and price will likely go back to re-test 0.0325.
- *Danger:* 1H RSI was at *77.5* - overbought. So a small pullback to 0.0355 - 0.0365 is very normal before going up again. Don't chase the green candle at the top. a53f
PARTI is a small cap - Market cap ∼$25.89M, Rank #543, and price is still *-92.41% below its ATH of $0.428*. So moves are fast and volatile. $PARTI
$BTC $ETH
#AnthropicPlungesTowardIPOPriceonDay2 #TwentyOneCapitalAdds172.25BTC
Current price on your chart: *∼0.03814 USDT*
Live price right now: *∼0.0383 USDT, +18.5% in 24h* - Open 0.0324, High 0.0393, Low 0.0309 5f12
What the chart is telling
*1. Big picture = Still Downtrend*
- Top was around *0.06400* on 29 Oct - sharp pump and dump
- After that price made lower highs all the way down
- On 9-10 Nov, it broke down hard from *0.04900* to *0.03300* in one move. That 0.049 level was the major breakdown point.
*2. Then 10 days of sideways / accumulation*
- From 10 Nov to 20 Nov, price was stuck in a tight range:
- *Support: 0.0325 - 0.0330*
- *Resistance: 0.0350 - 0.0355*
- It tested the 0.0325 support 3-4 times and held. That is why it didn't fall further.
*3. Now = Breakout attempt*
- Last 2 candles on your chart: strong green move from 0.0325 straight to 0.03814
- This is a breakout above the 0.0355 range high.
- On 1H and 4H, structure has turned bullish, but on Daily it is still bearish a53f
Key Levels to Watch
Level Type
**0.0325 - 0.0330** Major Support / Flip level - 4H close below this turns it bearish again
**0.0350 - 0.0355** Old resistance, now should act as support
**0.0380 - 0.0393** Current resistance / Today's high
**0.0440 - 0.0480** Next major resistance zone
**0.0490 - 0.0500** Breakdown zone - very heavy supply, the red box on your chart
My Read
- *If price holds above 0.0355 on 4H close:* Bullish continuation is open towards 0.0440, then 0.0480. The move has momentum.
- *If price falls back below 0.0355:* This breakout was a fakeout / trap, and price will likely go back to re-test 0.0325.
- *Danger:* 1H RSI was at *77.5* - overbought. So a small pullback to 0.0355 - 0.0365 is very normal before going up again. Don't chase the green candle at the top. a53f
PARTI is a small cap - Market cap ∼$25.89M, Rank #543, and price is still *-92.41% below its ATH of $0.428*. So moves are fast and volatile. $PARTI
$BTC $ETH
#AnthropicPlungesTowardIPOPriceonDay2 #TwentyOneCapitalAdds172.25BTC