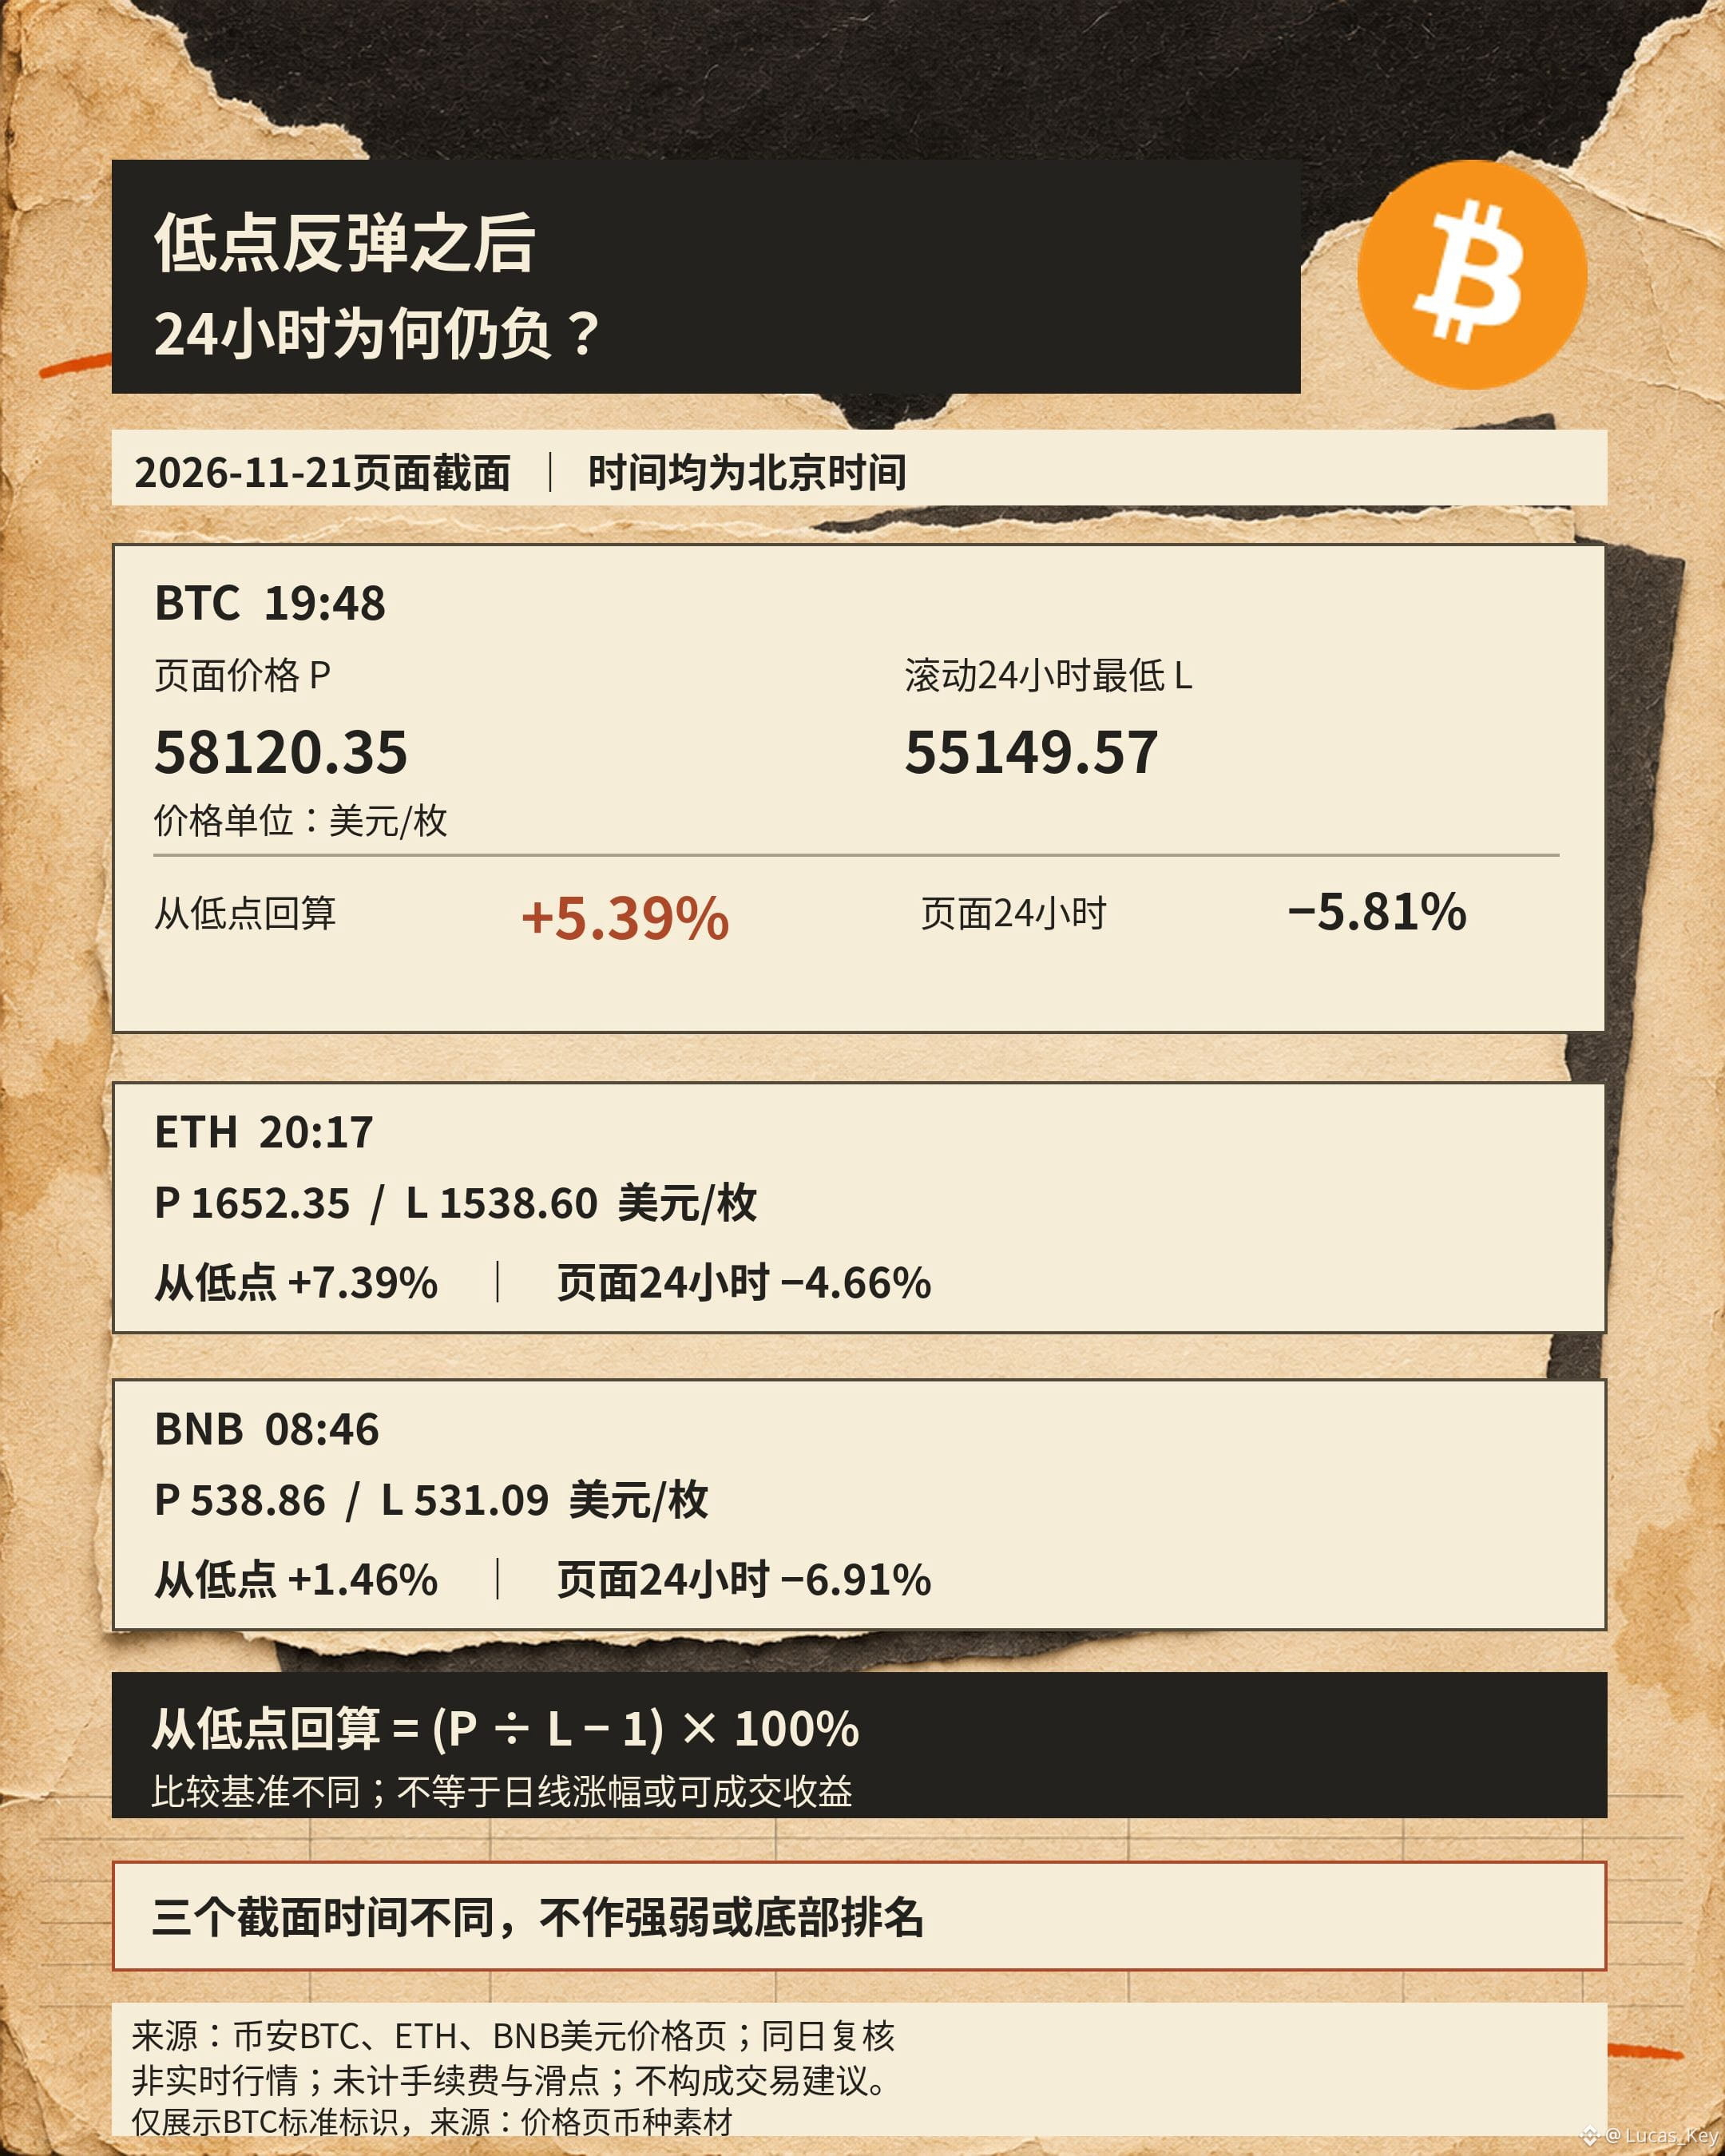
$BTC rebounded 5.39% from its low, yet was still down 5.81% over 24 hours. Which number is misleading? In the snapshot on Binance’s price page at 19:48 Beijing time on November 21, both figures can be true: the page showed a price of $58,120.35 and a rolling 24-hour low of $55,149.57. The first compares the price with the low; the second compares it with the reference price from 24 hours earlier. Change the denominator, and the market story changes.
A rebound from the low at least shows that, at the time of the snapshot, the price had moved away from its extreme low, leaving room for the interpretation that “selling pressure has temporarily eased.” But the negative 24-hour figure also supports a different caution: this rally has yet to recover the corresponding reference point. Looking at either figure alone cannot confirm that the trend has reversed.
The same calculation can be applied to $ETH and $BNB . The ETH page showed a price of $1,652.35 and a low of $1,538.60 at 20:17 on November 21, which works out to a 7.39% rise from the low; the page showed a 4.66% decline over 24 hours. The BNB page showed a price of $538.86 and a low of $531.09 at 08:46 that day, which works out to a 1.46% rise from the low; the 24-hour decline was 6.91%. The snapshots are from different times, so they can’t be used to rank which performed best tonight, much less combined into a market-wide picture from a single moment.
The calculation is “page price ÷ rolling-period low − 1,” multiplied by 100%. It measures how far the price is from the period low; it is not a daily percentage change, a return from buying the dip, or the probability that the market has bottomed. The period low also doesn’t mean that an ordinary user could have traded at that price. This is price arithmetic only; fees and slippage are not included.
I’m more interested in what happens next over the same period and at the same time: if the rebound is quickly wiped out, the interpretation of temporary relief needs to be revised. Consecutive closes that recover the earlier losses, together with verifiable trading volume, would provide stronger evidence of recovery. There is still a gap between a screen turning green and a trend recovering—a gap involving both the comparison baseline and how long the move lasts.
Source: The snapshots above from Binance’s BTC, ETH, and BNB USD price pages; checked on 2026-11-21, not real-time market data. Volatility and drawdown risks remain. This is not trading advice. This post may receive platform creator rewards.
A rebound from the low at least shows that, at the time of the snapshot, the price had moved away from its extreme low, leaving room for the interpretation that “selling pressure has temporarily eased.” But the negative 24-hour figure also supports a different caution: this rally has yet to recover the corresponding reference point. Looking at either figure alone cannot confirm that the trend has reversed.
The same calculation can be applied to $ETH and $BNB . The ETH page showed a price of $1,652.35 and a low of $1,538.60 at 20:17 on November 21, which works out to a 7.39% rise from the low; the page showed a 4.66% decline over 24 hours. The BNB page showed a price of $538.86 and a low of $531.09 at 08:46 that day, which works out to a 1.46% rise from the low; the 24-hour decline was 6.91%. The snapshots are from different times, so they can’t be used to rank which performed best tonight, much less combined into a market-wide picture from a single moment.
The calculation is “page price ÷ rolling-period low − 1,” multiplied by 100%. It measures how far the price is from the period low; it is not a daily percentage change, a return from buying the dip, or the probability that the market has bottomed. The period low also doesn’t mean that an ordinary user could have traded at that price. This is price arithmetic only; fees and slippage are not included.
I’m more interested in what happens next over the same period and at the same time: if the rebound is quickly wiped out, the interpretation of temporary relief needs to be revised. Consecutive closes that recover the earlier losses, together with verifiable trading volume, would provide stronger evidence of recovery. There is still a gap between a screen turning green and a trend recovering—a gap involving both the comparison baseline and how long the move lasts.
Source: The snapshots above from Binance’s BTC, ETH, and BNB USD price pages; checked on 2026-11-21, not real-time market data. Volatility and drawdown risks remain. This is not trading advice. This post may receive platform creator rewards.