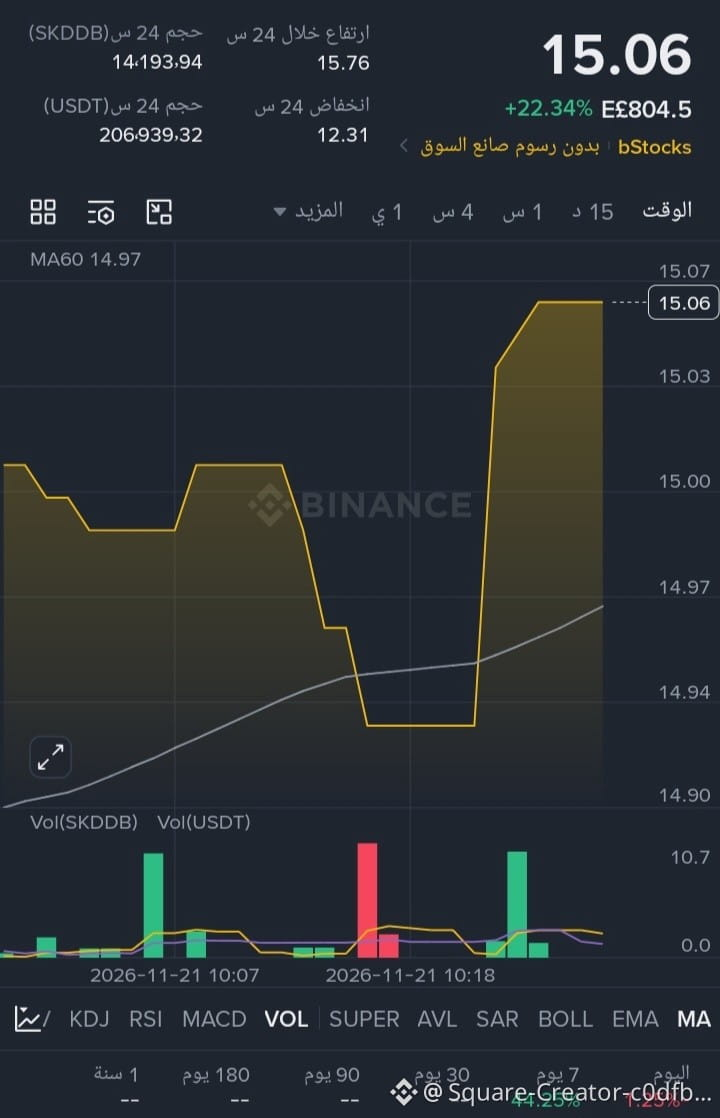
A strong surge and sudden rise are drawing attention to SKDDB after daily gains of +22.34%, bringing the price to 15.06 amid active trading that calls for precision when choosing entry and exit points and avoiding rapid reversals!
Technical Analysis and Indicators
The price is trading above the MA60 average, shown at 14.97, reinforcing the short-term positive outlook as long as it holds above this level.
The 24-hour trading range recorded a high of 15.76 and a low of 12.31, with trading volume reaching 14,193.94 SKDDB and 206,939.32 USDT.
The chart shows a temporary pullback toward 14.94, followed by a sharp upward breakout supported by a prominent green volume candle at the bottom of the chart, reflecting a strong, immediate influx of liquidity.
Buy and Sell Zones and Targets
Buy zones: It is preferable to wait for a calm corrective pullback toward 15.00 - 14.97, or a retest near 14.94, rather than entering late after the rapid surge.
Sell zones / Stop-loss: Take partial profits or exit if 14.94 is decisively broken, with a break below 14.90 considered a clear negative signal for immediate momentum.
Upside targets:
First target: 15.07 (testing the intraday high shown on the chart).
Second target: 15.40 if buying momentum and liquidity continue.
Third target: 15.76 (retesting the highest level in the past 24 hours).
Do you think this upward wave will continue to surge, or will it soon settle into sideways trading? Share your thoughts in the comments.
#SKDDB #تداول_العملات_الرقمية #التحليل_الفني #بينانس #$SKDDB
Technical Analysis and Indicators
The price is trading above the MA60 average, shown at 14.97, reinforcing the short-term positive outlook as long as it holds above this level.
The 24-hour trading range recorded a high of 15.76 and a low of 12.31, with trading volume reaching 14,193.94 SKDDB and 206,939.32 USDT.
The chart shows a temporary pullback toward 14.94, followed by a sharp upward breakout supported by a prominent green volume candle at the bottom of the chart, reflecting a strong, immediate influx of liquidity.
Buy and Sell Zones and Targets
Buy zones: It is preferable to wait for a calm corrective pullback toward 15.00 - 14.97, or a retest near 14.94, rather than entering late after the rapid surge.
Sell zones / Stop-loss: Take partial profits or exit if 14.94 is decisively broken, with a break below 14.90 considered a clear negative signal for immediate momentum.
Upside targets:
First target: 15.07 (testing the intraday high shown on the chart).
Second target: 15.40 if buying momentum and liquidity continue.
Third target: 15.76 (retesting the highest level in the past 24 hours).
Do you think this upward wave will continue to surge, or will it soon settle into sideways trading? Share your thoughts in the comments.
#SKDDB #تداول_العملات_الرقمية #التحليل_الفني #بينانس #$SKDDB