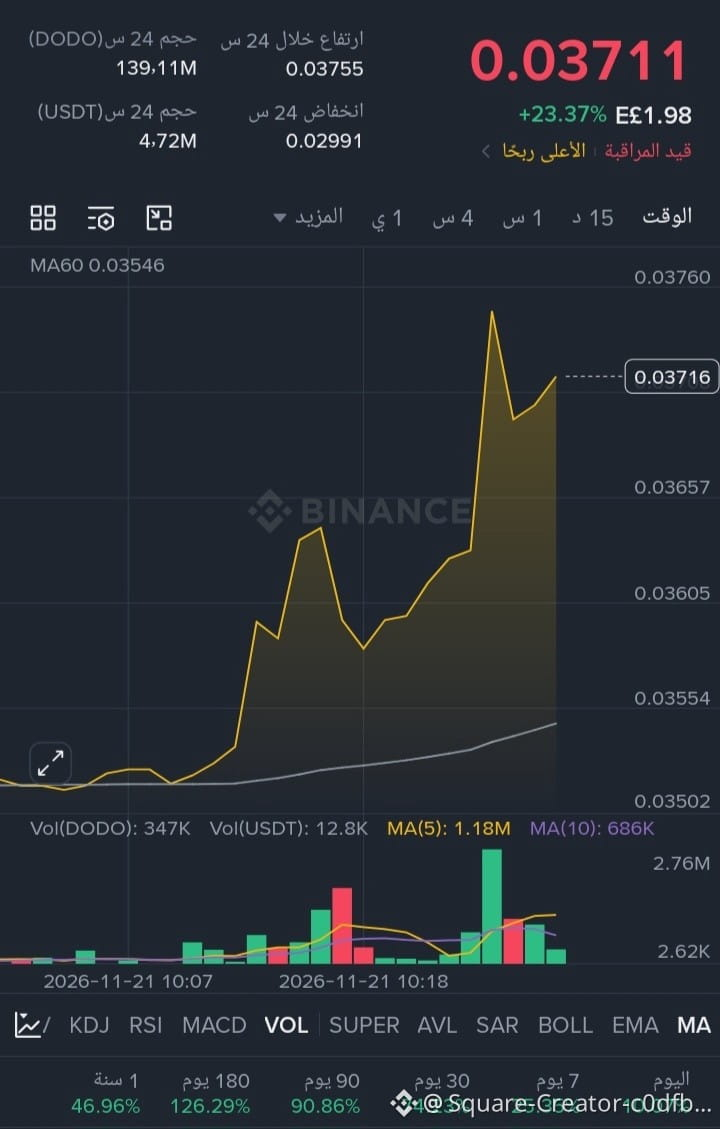
Strong momentum and notable buying pressure are drawing attention to DODO after a daily surge of more than +23.37%, with the price settling near 0.03711. This rapid move calls for careful analysis to seize opportunities and avoid reversals near the highs!
Technical Analysis and Indicators
The price is trading above the MA60 average, shown at 0.03546, supporting the continuation of short-term upward momentum as long as the price holds above it.
The 24-hour trading range recorded a high of 0.03755 and a low of 0.02991, with a trading volume of 139.11M DODO and 4.72M USDT.
The chart shows a sharp, gradual rise followed by an accelerating move toward the latest high. Active green volume bars at the bottom of the chart reflect a rapid influx of short-term liquidity.
Buy and Sell Zones and Targets
Buy zones: It is preferable to wait for a measured pullback toward 0.03657 - 0.03605, or a bounce near the 0.03554 - 0.03546 support area, rather than chasing the price directly after the sharp rise.
Sell zones / Stop-loss: Take partial profits or exit if the price breaks below 0.03540 and holds there. A break below 0.03502 would be a clear sign of weakening short-term momentum.
Upside targets:
First target: 0.03755 (a retest of the 24-hour high).
Second target: 0.03820 if the daily high is broken decisively with supporting liquidity.
Third target: 0.03900 as an extension target for the upward wave.
#DODO #تداول_العملات_الرقمية #التحليل_الفني #$DODO
#بينانس
Technical Analysis and Indicators
The price is trading above the MA60 average, shown at 0.03546, supporting the continuation of short-term upward momentum as long as the price holds above it.
The 24-hour trading range recorded a high of 0.03755 and a low of 0.02991, with a trading volume of 139.11M DODO and 4.72M USDT.
The chart shows a sharp, gradual rise followed by an accelerating move toward the latest high. Active green volume bars at the bottom of the chart reflect a rapid influx of short-term liquidity.
Buy and Sell Zones and Targets
Buy zones: It is preferable to wait for a measured pullback toward 0.03657 - 0.03605, or a bounce near the 0.03554 - 0.03546 support area, rather than chasing the price directly after the sharp rise.
Sell zones / Stop-loss: Take partial profits or exit if the price breaks below 0.03540 and holds there. A break below 0.03502 would be a clear sign of weakening short-term momentum.
Upside targets:
First target: 0.03755 (a retest of the 24-hour high).
Second target: 0.03820 if the daily high is broken decisively with supporting liquidity.
Third target: 0.03900 as an extension target for the upward wave.
#DODO #تداول_العملات_الرقمية #التحليل_الفني #$DODO
#بينانس