$BTC
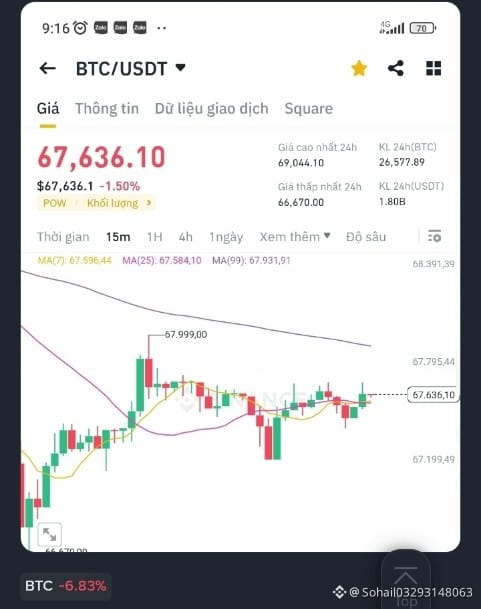
Below is a short analysis of the BTC/USDT trading chart to determine the current trend:
1. **Price Movement**: Current price is $67,636.10, down 1.50% on the day.
2. **Moving average (MA)**:
- MA(7): $67,596.44
- MA(25): $67,584.10
- MA(99): $67,931.91
The price is currently close to the 7-day and 25-day MA, but below the 99-day MA, suggesting possible short-term consolidation with longer-term downward pressure.
3. **MACD (Moving Average Convergence Divergence)**:
- DIF: 3.87
- DEA: -7.74
- MACD: 11.61
The MACD histogram shows positive values, which could suggest a bullish crossover or short-term bullish momentum.
4. **RSI (Relative Strength Index)**:
- RSI(6): 59.18
An RSI value of 59.18 shows that the asset is neither overbought nor oversold, but closer to higher levels, which can be interpreted as quite positive.
5. **Volume**:
- 24-hour trading volume is quite large, indicating strong trading activity and can lead to volatility.
6. **Support and resistance**:
- The chart shows a recent high of $67,999.00 and a recent low of $66,670.00. The current price is close to the middle of this range, indicating a consolidation phase.
7. **Market sentiment indicator**:
- Purchase rate (Buy) is 40.62%
- Selling rate (Sell) is 59.38%
Current market sentiment is slightly inclined to the downside.
### Summary
The BTC/USDT chart shows that the market is currently in a consolidation phase with short-term bullish momentum. However, there is still significant resistance from the long-term MA. With mixed indicators (MACD shows some bullish momentum but price is below the long-term MA and market sentiment is bearish), it is possible to be cautious and watch for clear signals.$BTC
#BNBDropsBelow540USDTWith8.46%DailyDecline
#TwentyOneCapitalAdds172.25BTC
#AnthropicPlungesTowardIPOPriceonDay2
#GlobalStocksFaceLongestLosingStreakSince2023
#CanBTCReboundAfterFallingBelow60K?
Below is a short analysis of the BTC/USDT trading chart to determine the current trend:
1. **Price Movement**: Current price is $67,636.10, down 1.50% on the day.
2. **Moving average (MA)**:
- MA(7): $67,596.44
- MA(25): $67,584.10
- MA(99): $67,931.91
The price is currently close to the 7-day and 25-day MA, but below the 99-day MA, suggesting possible short-term consolidation with longer-term downward pressure.
3. **MACD (Moving Average Convergence Divergence)**:
- DIF: 3.87
- DEA: -7.74
- MACD: 11.61
The MACD histogram shows positive values, which could suggest a bullish crossover or short-term bullish momentum.
4. **RSI (Relative Strength Index)**:
- RSI(6): 59.18
An RSI value of 59.18 shows that the asset is neither overbought nor oversold, but closer to higher levels, which can be interpreted as quite positive.
5. **Volume**:
- 24-hour trading volume is quite large, indicating strong trading activity and can lead to volatility.
6. **Support and resistance**:
- The chart shows a recent high of $67,999.00 and a recent low of $66,670.00. The current price is close to the middle of this range, indicating a consolidation phase.
7. **Market sentiment indicator**:
- Purchase rate (Buy) is 40.62%
- Selling rate (Sell) is 59.38%
Current market sentiment is slightly inclined to the downside.
### Summary
The BTC/USDT chart shows that the market is currently in a consolidation phase with short-term bullish momentum. However, there is still significant resistance from the long-term MA. With mixed indicators (MACD shows some bullish momentum but price is below the long-term MA and market sentiment is bearish), it is possible to be cautious and watch for clear signals.$BTC
#BNBDropsBelow540USDTWith8.46%DailyDecline
#TwentyOneCapitalAdds172.25BTC
#AnthropicPlungesTowardIPOPriceonDay2
#GlobalStocksFaceLongestLosingStreakSince2023
#CanBTCReboundAfterFallingBelow60K?