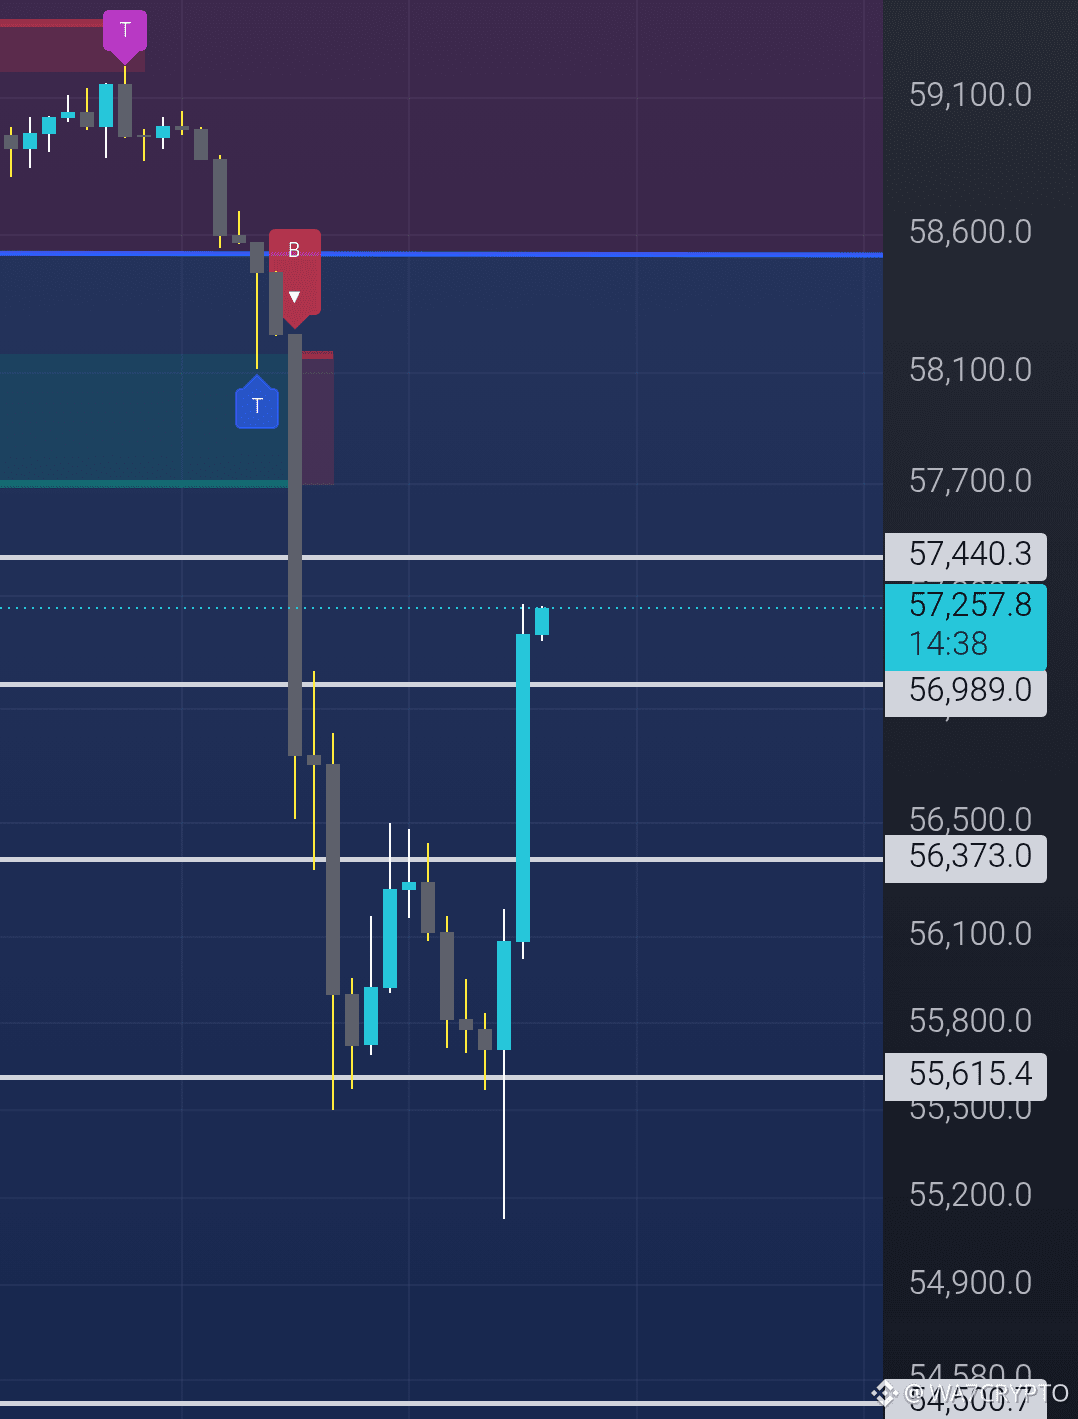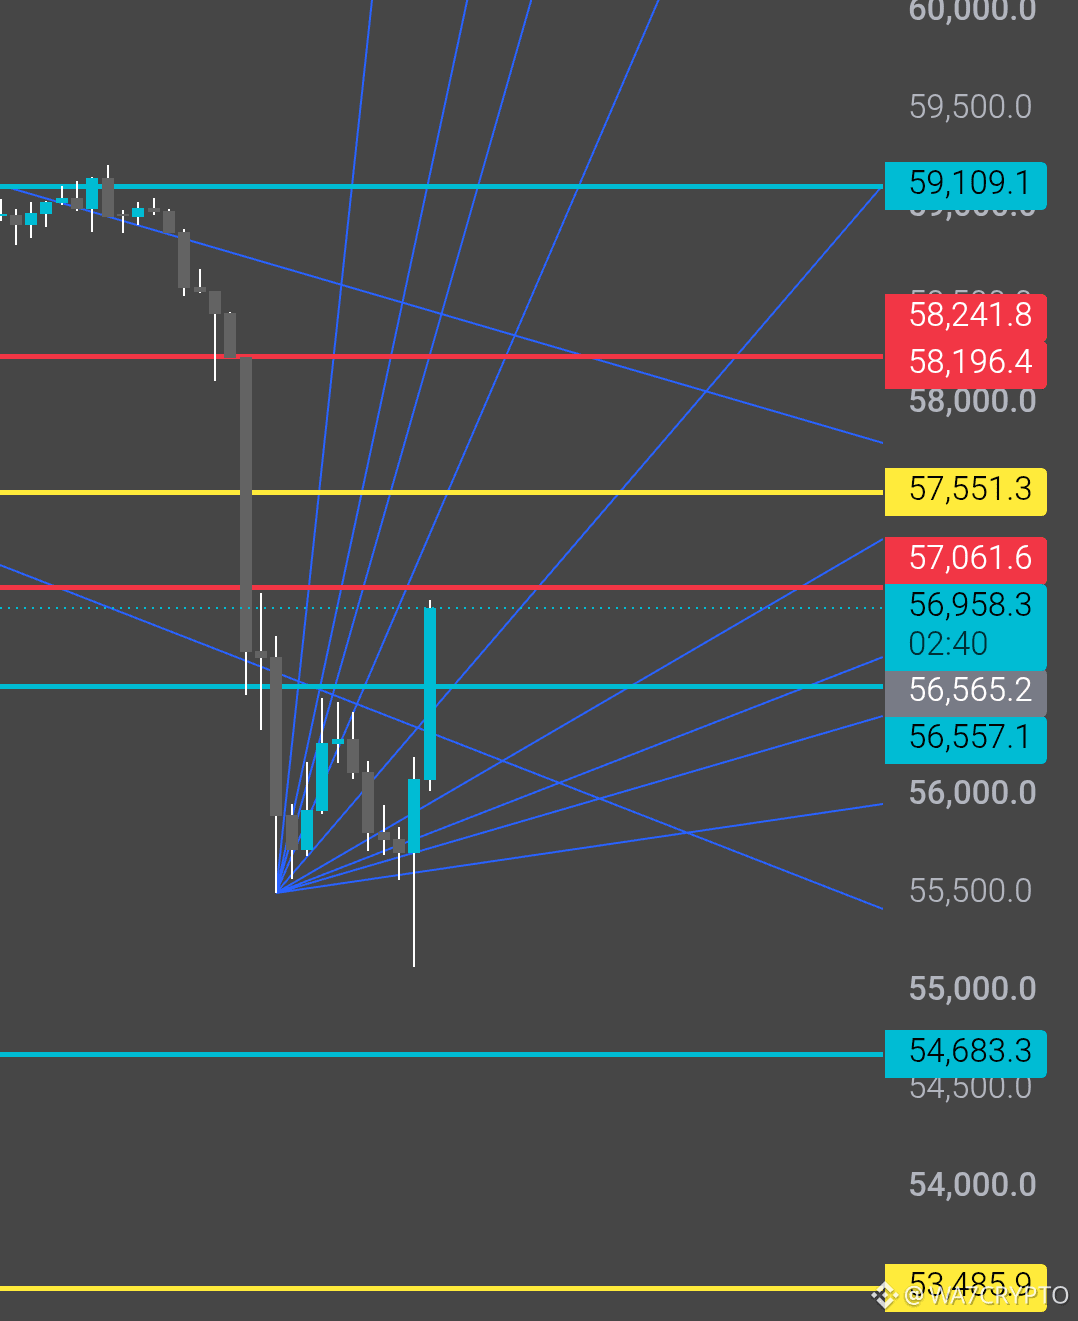

Two charts, all different from each other, but why are they similar? The reason is clear. I analyze $BTC thoroughly and know where it might bounce. While it's true that it broke the downtrend, a bounce is very likely from here, and everyone knows why this correction is happening now; no one can deny it.