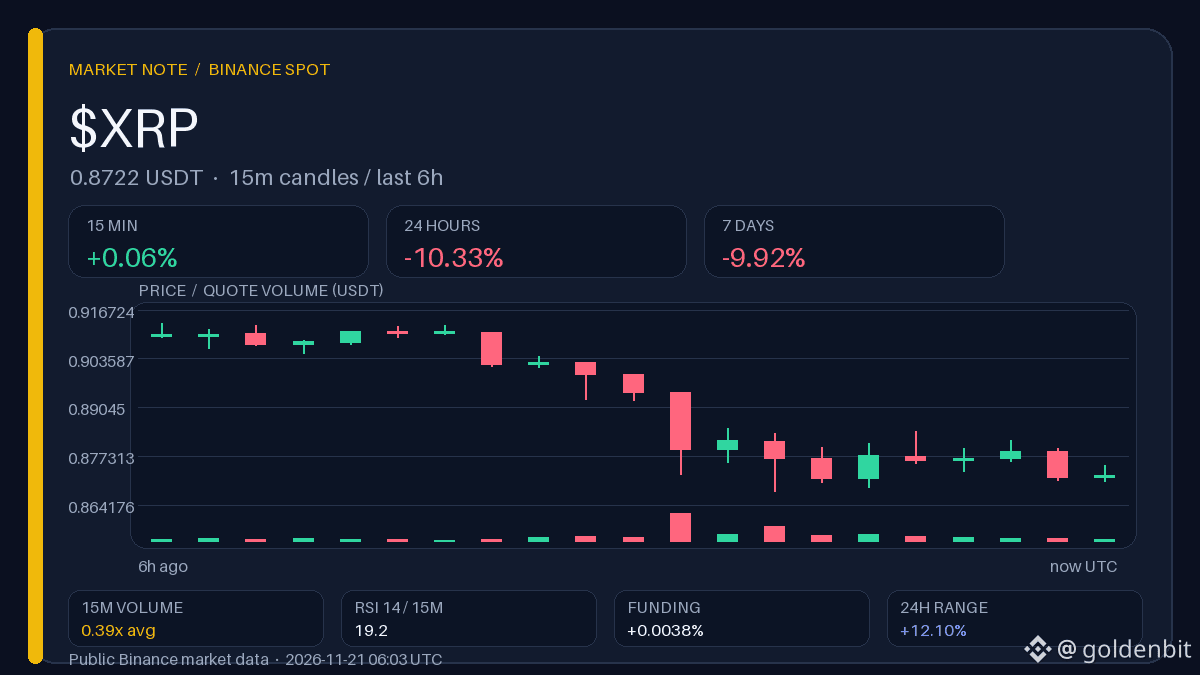
$XRP: down 10.33% in 24 hours on the news, but the 15-minute chart is already green
The market's reaction to the headline about long-position unwinding and ETFs still looks like a pause, not a reversal. Volume on the 15-minute chart is 0.39 of normal, RSI is 19.2: the bounce is unfolding without confirmation, but selling pressure isn't increasing either.
Observation range · 5 h
Above 0.913100: Holding above the upper boundary of the local range would support the hypothesis that the rebound's momentum has turned into a short-term trend change.
Below 0.867800: A return to the lower boundary of the range would mean the bounce was just noise within the daily decline.
These are historical levels; a single wick does not confirm a scenario.
🗞 News: CoinDesk.
The headline attributes the drop to long-position unwinding, but the price is already at the lower boundary of the range — what would confirm a momentum shift?
Binance data, snapshot at 06:03 UTC. The author may receive rewards through Binance Square Write to Earn.
The market's reaction to the headline about long-position unwinding and ETFs still looks like a pause, not a reversal. Volume on the 15-minute chart is 0.39 of normal, RSI is 19.2: the bounce is unfolding without confirmation, but selling pressure isn't increasing either.
Observation range · 5 h
Above 0.913100: Holding above the upper boundary of the local range would support the hypothesis that the rebound's momentum has turned into a short-term trend change.
Below 0.867800: A return to the lower boundary of the range would mean the bounce was just noise within the daily decline.
These are historical levels; a single wick does not confirm a scenario.
🗞 News: CoinDesk.
The headline attributes the drop to long-position unwinding, but the price is already at the lower boundary of the range — what would confirm a momentum shift?
Binance data, snapshot at 06:03 UTC. The author may receive rewards through Binance Square Write to Earn.