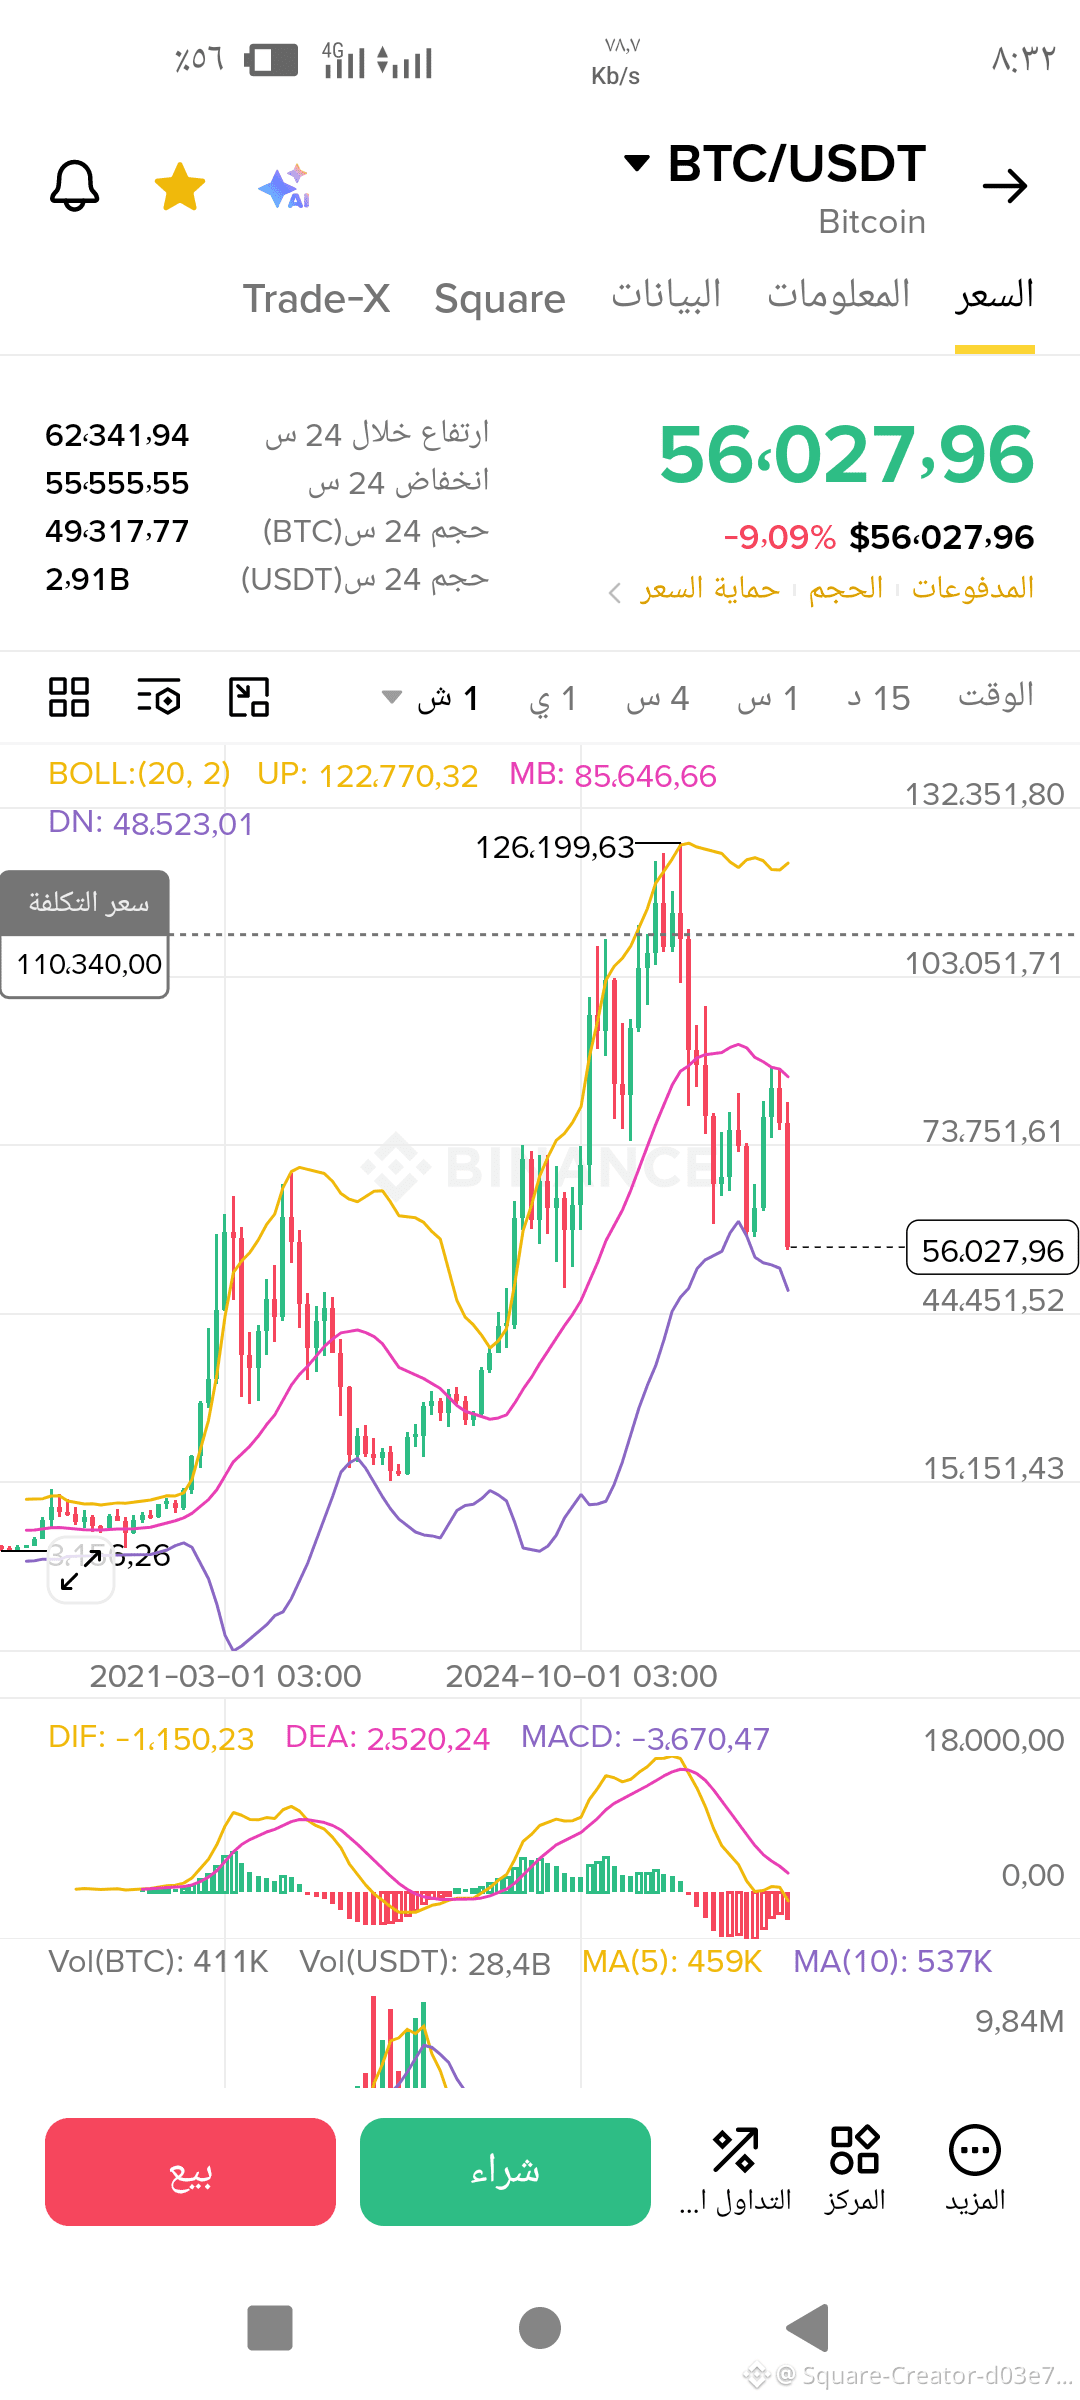
The current decline in **BTC/USDT** — visible on the chart near **$56,027.96**, down **-9.09%** — is in line with previous expectations pointing toward the **$53,000** area.
* **Trend and momentum:** A sharp drop from the peak of **$126,199.63**, with clear negative momentum in the MACD at **-3,670.47**, supporting continued selling pressure on the weekly timeframe.
* **Technical levels:** The price is moving toward the lower band of the BOLL:(20, 2) indicator at **$48,523.01**, followed by the **$44,451.52** level, amid daily trading volume of **2.91B USDT**.
Based on these factors, the correction may continue as long as negative technical signals persist. The specified targets remain dependent on price behavior at upcoming support levels and on risk management.
$BTC
* **Trend and momentum:** A sharp drop from the peak of **$126,199.63**, with clear negative momentum in the MACD at **-3,670.47**, supporting continued selling pressure on the weekly timeframe.
* **Technical levels:** The price is moving toward the lower band of the BOLL:(20, 2) indicator at **$48,523.01**, followed by the **$44,451.52** level, amid daily trading volume of **2.91B USDT**.
Based on these factors, the correction may continue as long as negative technical signals persist. The specified targets remain dependent on price behavior at upcoming support levels and on risk management.
$BTC