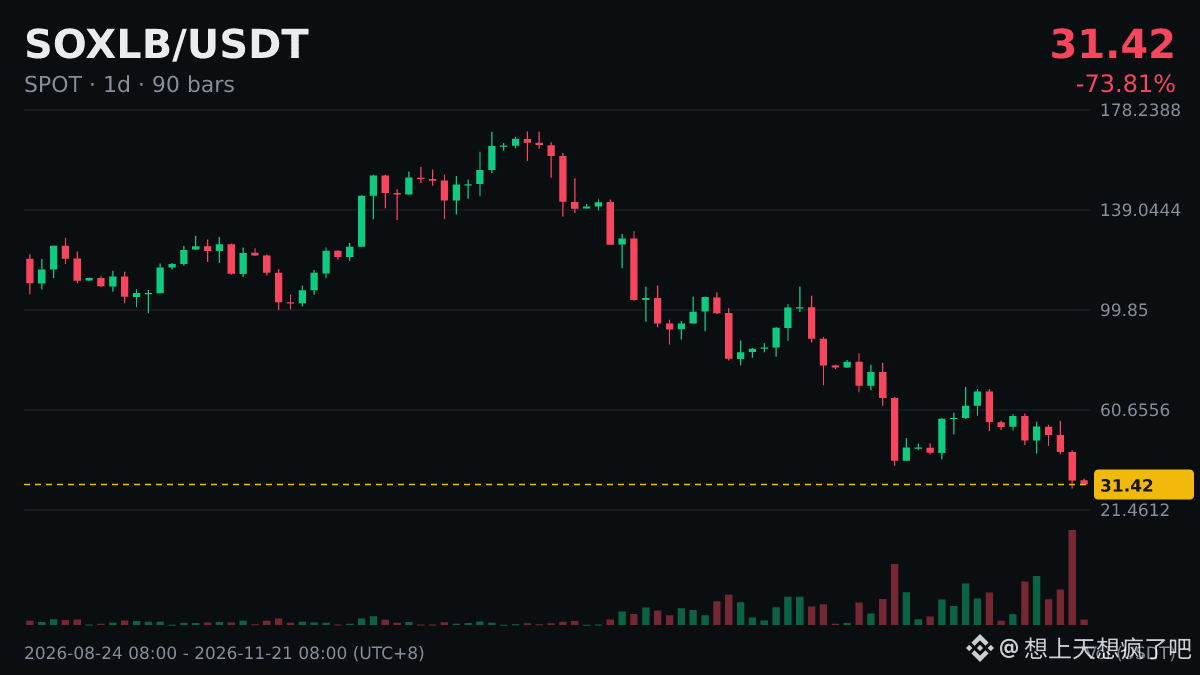
Consider this set of data:
Asset: $SOXLB
Daily MACD: bearish crossover below the zero line
Previous bullish momentum histogram: 10 daily candlesticks
24h: -26.94%
Interpretation: The rebound is over; this points to continued weakness.
No guarantee this is correct—make your own decision.
Asset: $SOXLB
Daily MACD: bearish crossover below the zero line
Previous bullish momentum histogram: 10 daily candlesticks
24h: -26.94%
Interpretation: The rebound is over; this points to continued weakness.
No guarantee this is correct—make your own decision.