#SC/USDT
Summary and connection
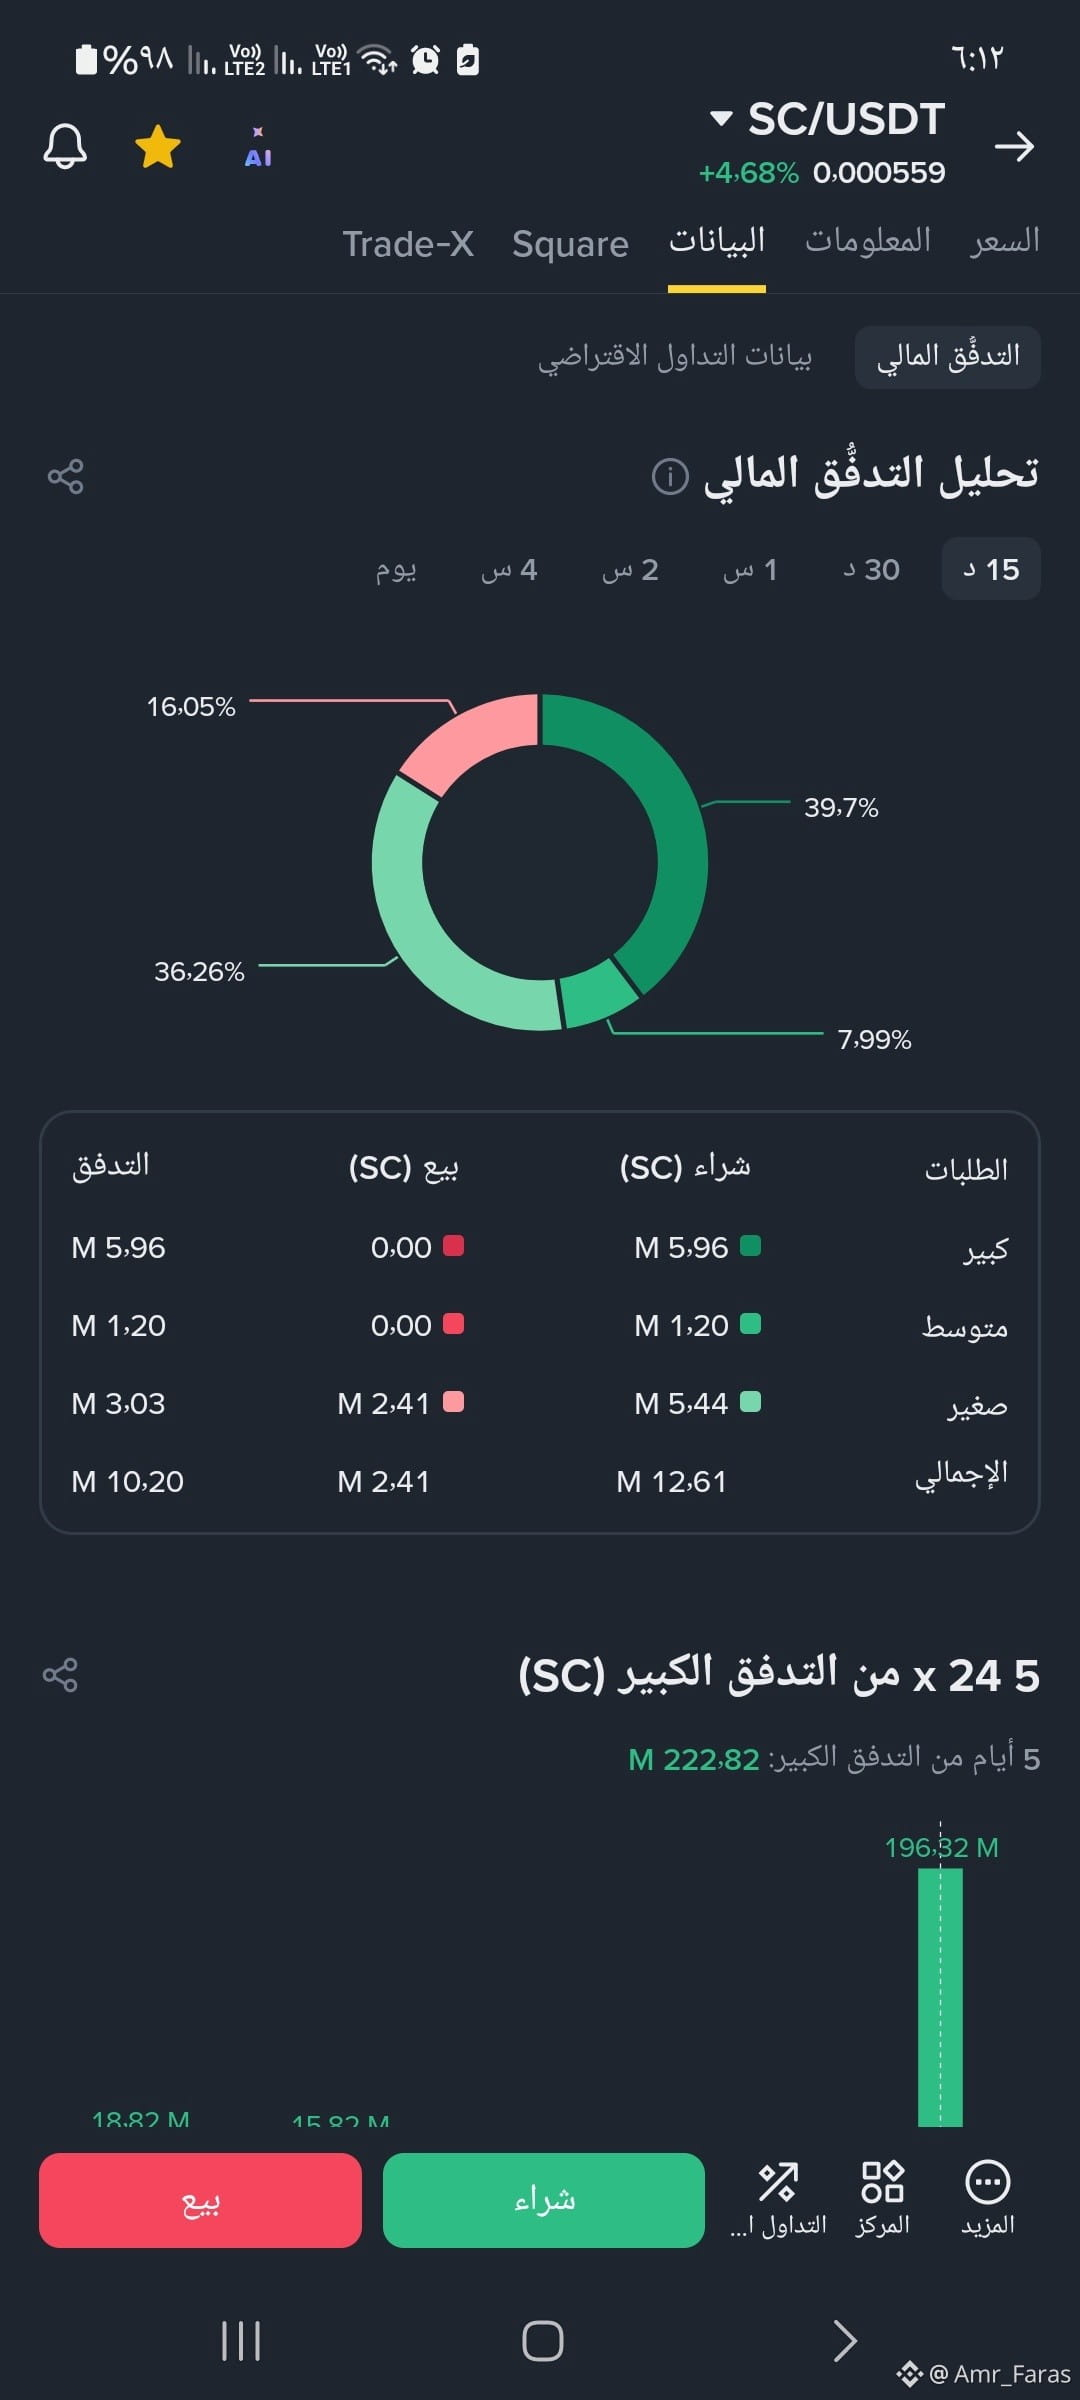
• Positive confluence. The last two green candles on the chart are actually supported by buying from large wallets and a lack of institutional selling in the last 15 minutes, while small traders are selling.
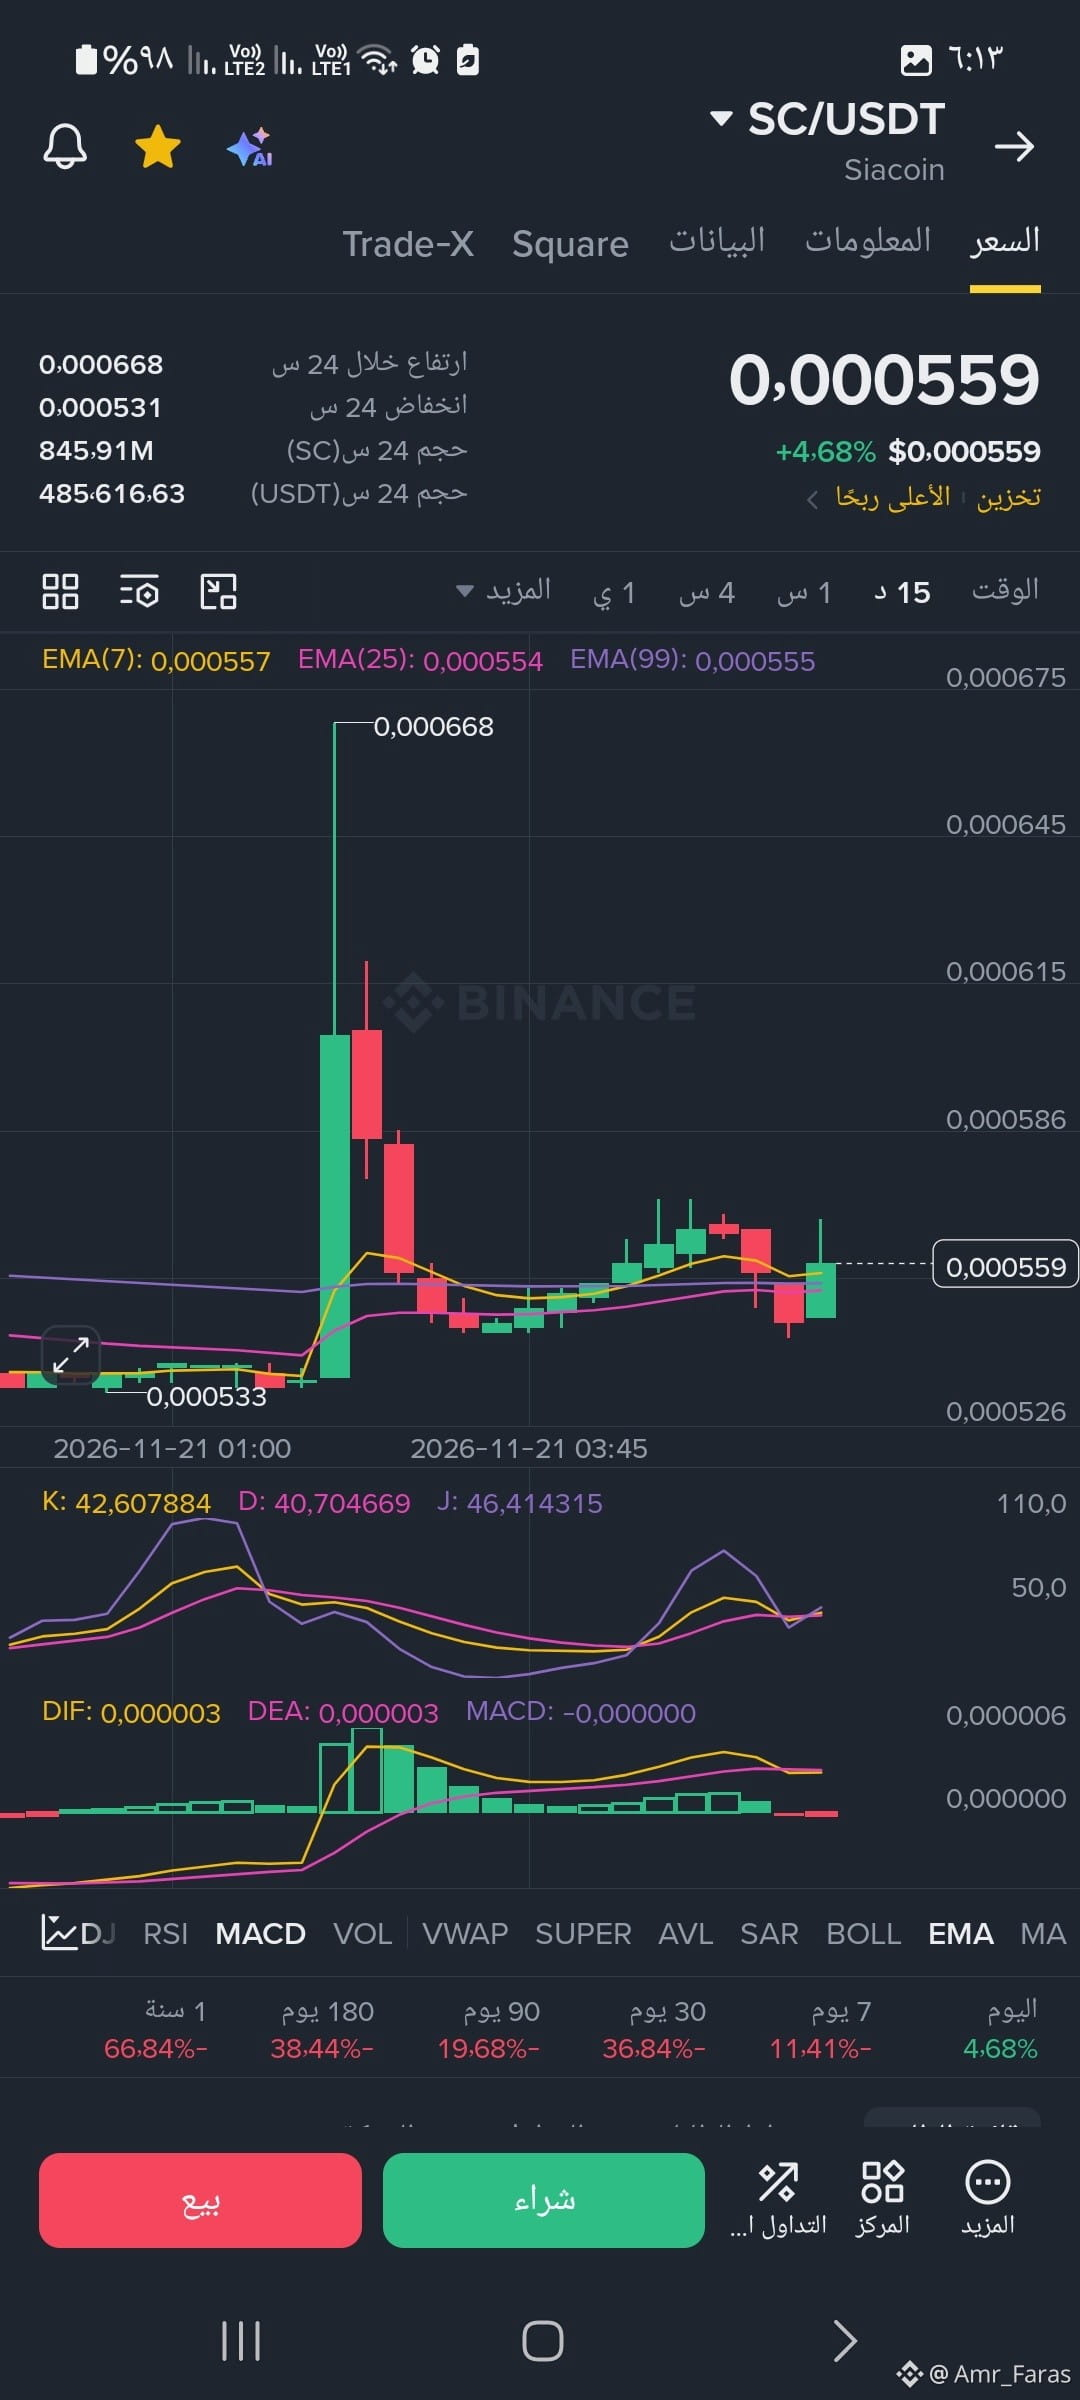
• Levels to watch. Holding above 0.000554 (the 25-period EMA) keeps the possibility of retesting 0.000586 and then 0.000615 open, while breaking below this level would mean the bounce has failed and a return to test
Summary and connection
• Positive confluence. The last two green candles on the chart are actually supported by buying from large wallets and a lack of institutional selling in the last 15 minutes, while small traders are selling.
• Levels to watch. Holding above 0.000554 (the 25-period EMA) keeps the possibility of retesting 0.000586 and then 0.000615 open, while breaking below this level would mean the bounce has failed and a return to test