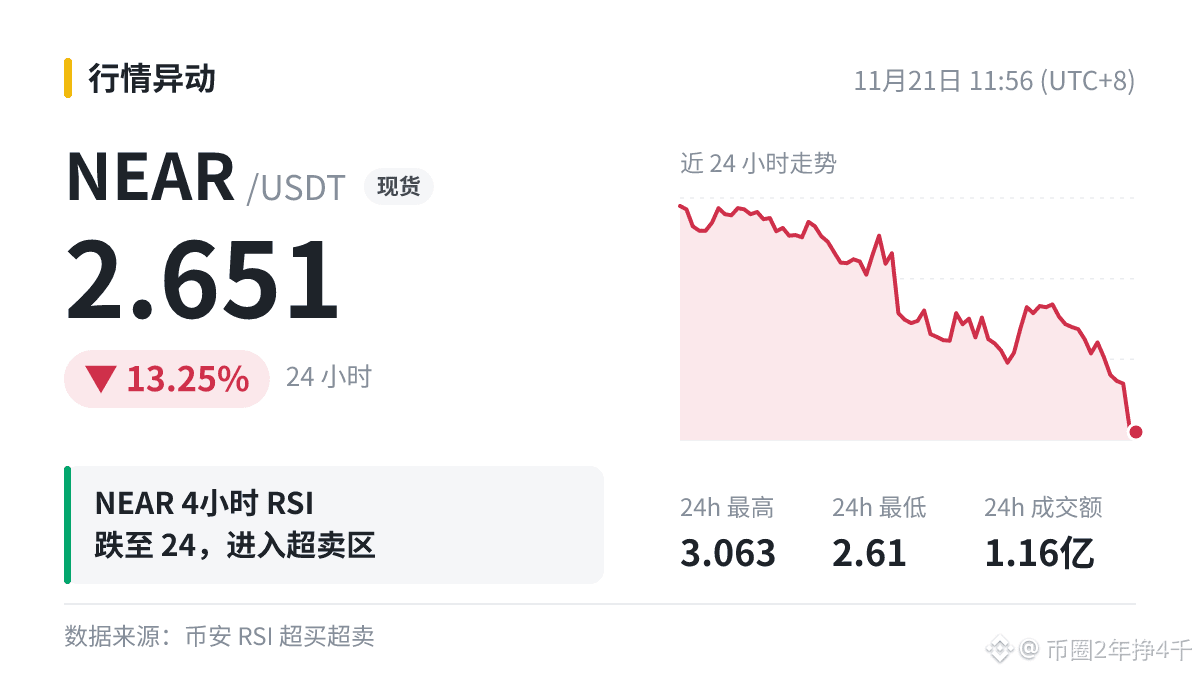
🐋 RSI over $NEAR 4 hours is 23.7, in oversold territory, with the current price at 2.651.
RSI itself doesn’t drive prices, but plenty of people watch it, so its reading can influence some people’s trading decisions.
A 14-period RSI uses 14 candlesticks: on a 4-hour chart, that covers just over two days (56 hours); on a daily chart, it covers two weeks.
Oversold just means prices have fallen too quickly and sharply recently. They may rebound, or they may spend a long time moving sideways at low levels before choosing a direction.
Understanding this indicator helps you avoid being spooked by a single number—not calculate the exact top or bottom.
#NEAR
RSI itself doesn’t drive prices, but plenty of people watch it, so its reading can influence some people’s trading decisions.
A 14-period RSI uses 14 candlesticks: on a 4-hour chart, that covers just over two days (56 hours); on a daily chart, it covers two weeks.
Oversold just means prices have fallen too quickly and sharply recently. They may rebound, or they may spend a long time moving sideways at low levels before choosing a direction.
Understanding this indicator helps you avoid being spooked by a single number—not calculate the exact top or bottom.
#NEAR