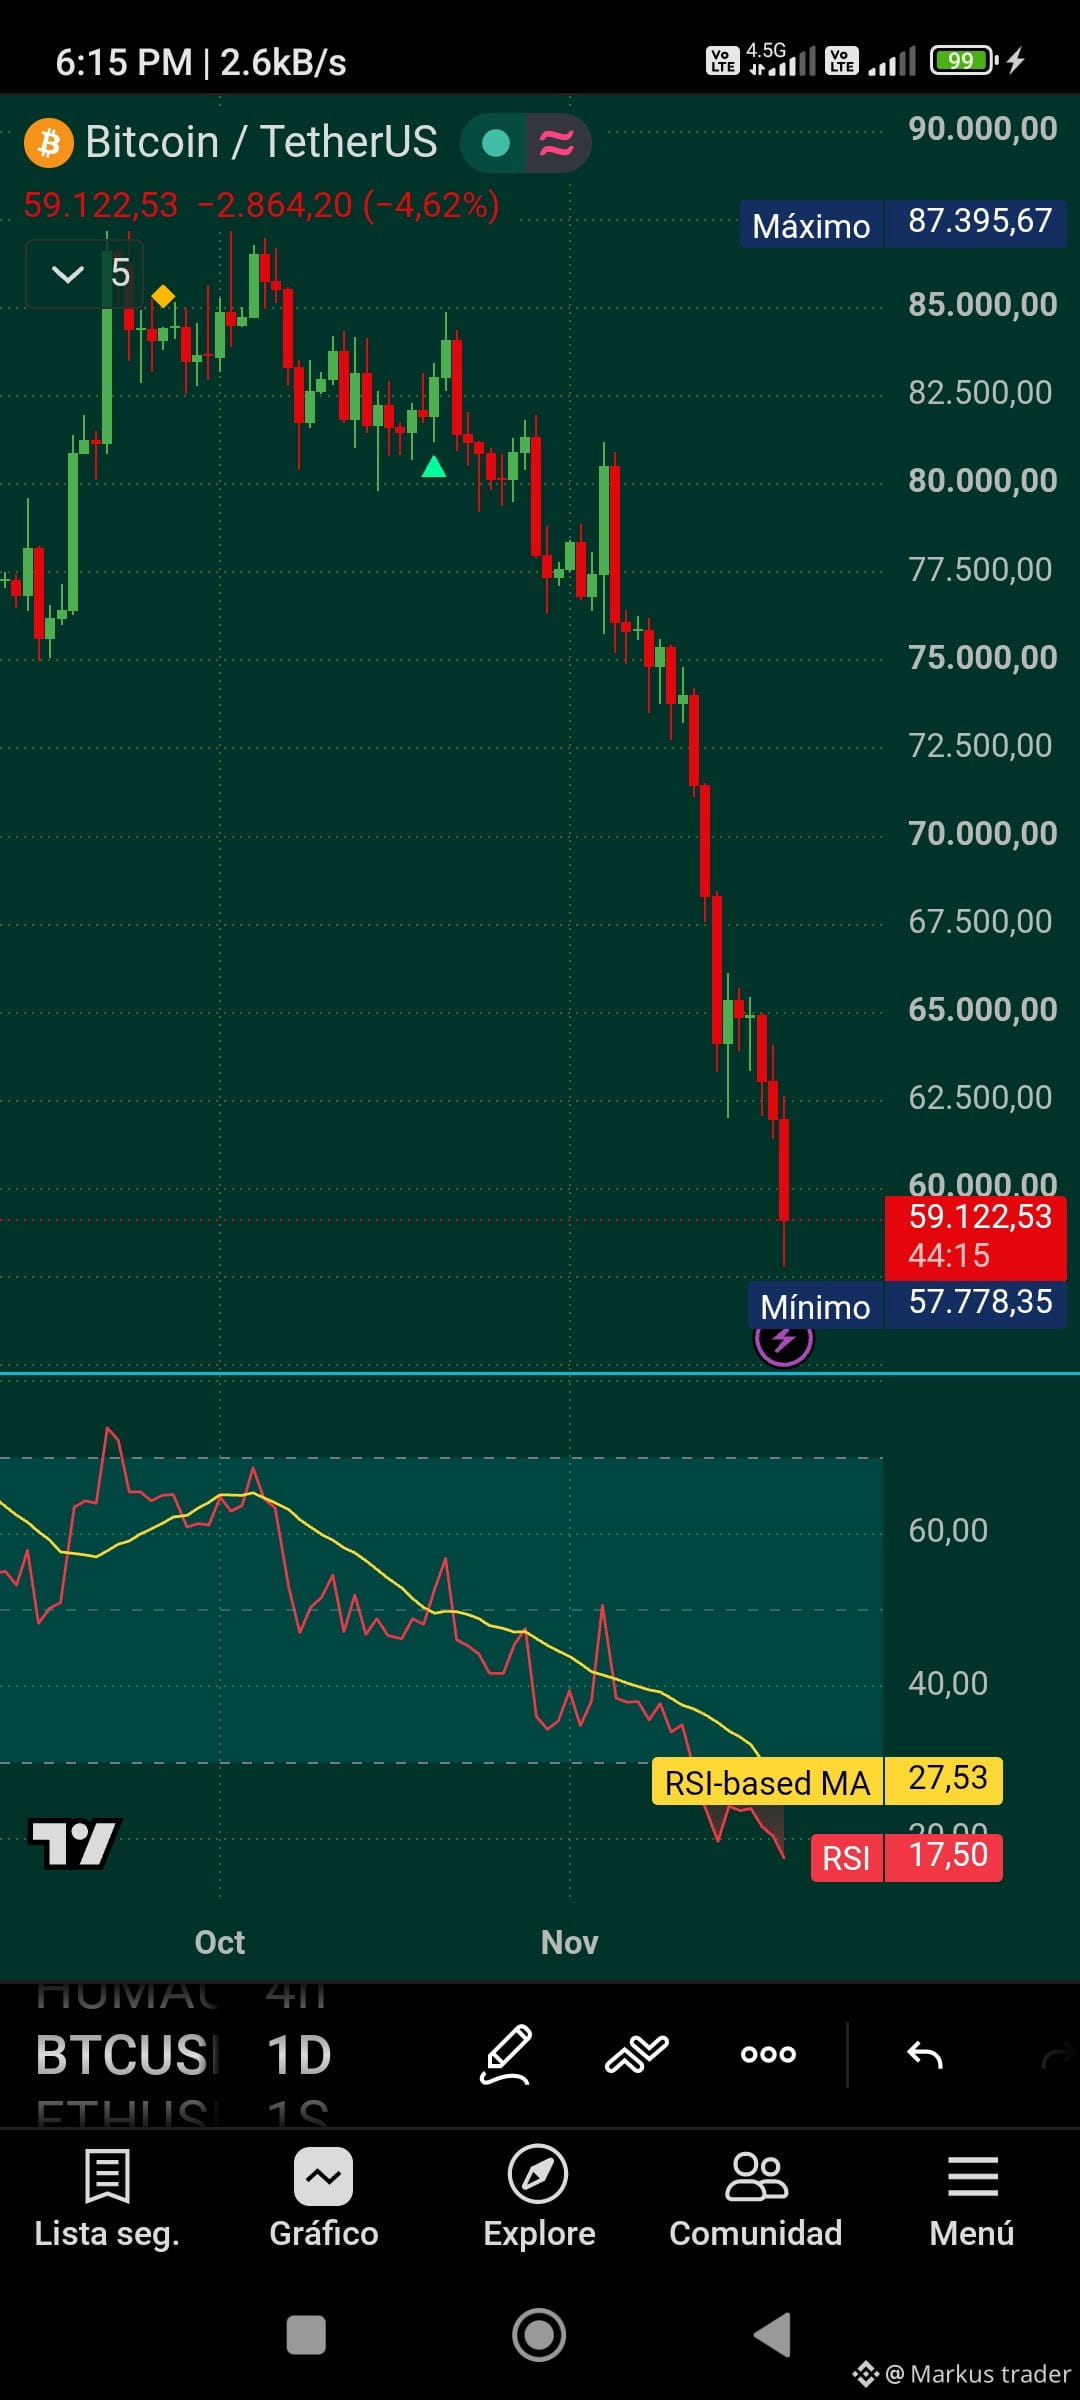
#btc The drop has been brutal. It began with a divergence on the daily chart at 87k, and we’ve fallen to 57k—a 30k drop in 7 weeks. The RSI is in the gutter at 17 points, indicating extreme oversold conditions. However, technically speaking, we’re in a potential rebound zone based on the RSI:
✅ February RSI: 16 points
✅ June RSI: 15.5 points
✅ November RSI: 17 points
✅ Daily timeframe
Based on the RSI technical data, if we haven’t reached the bottom yet, we’re very close—very close—to forming a reversal on the weekly timeframe.
✅ February RSI: 16 points
✅ June RSI: 15.5 points
✅ November RSI: 17 points
✅ Daily timeframe
Based on the RSI technical data, if we haven’t reached the bottom yet, we’re very close—very close—to forming a reversal on the weekly timeframe.