Trading Thesis|11/21 06:20
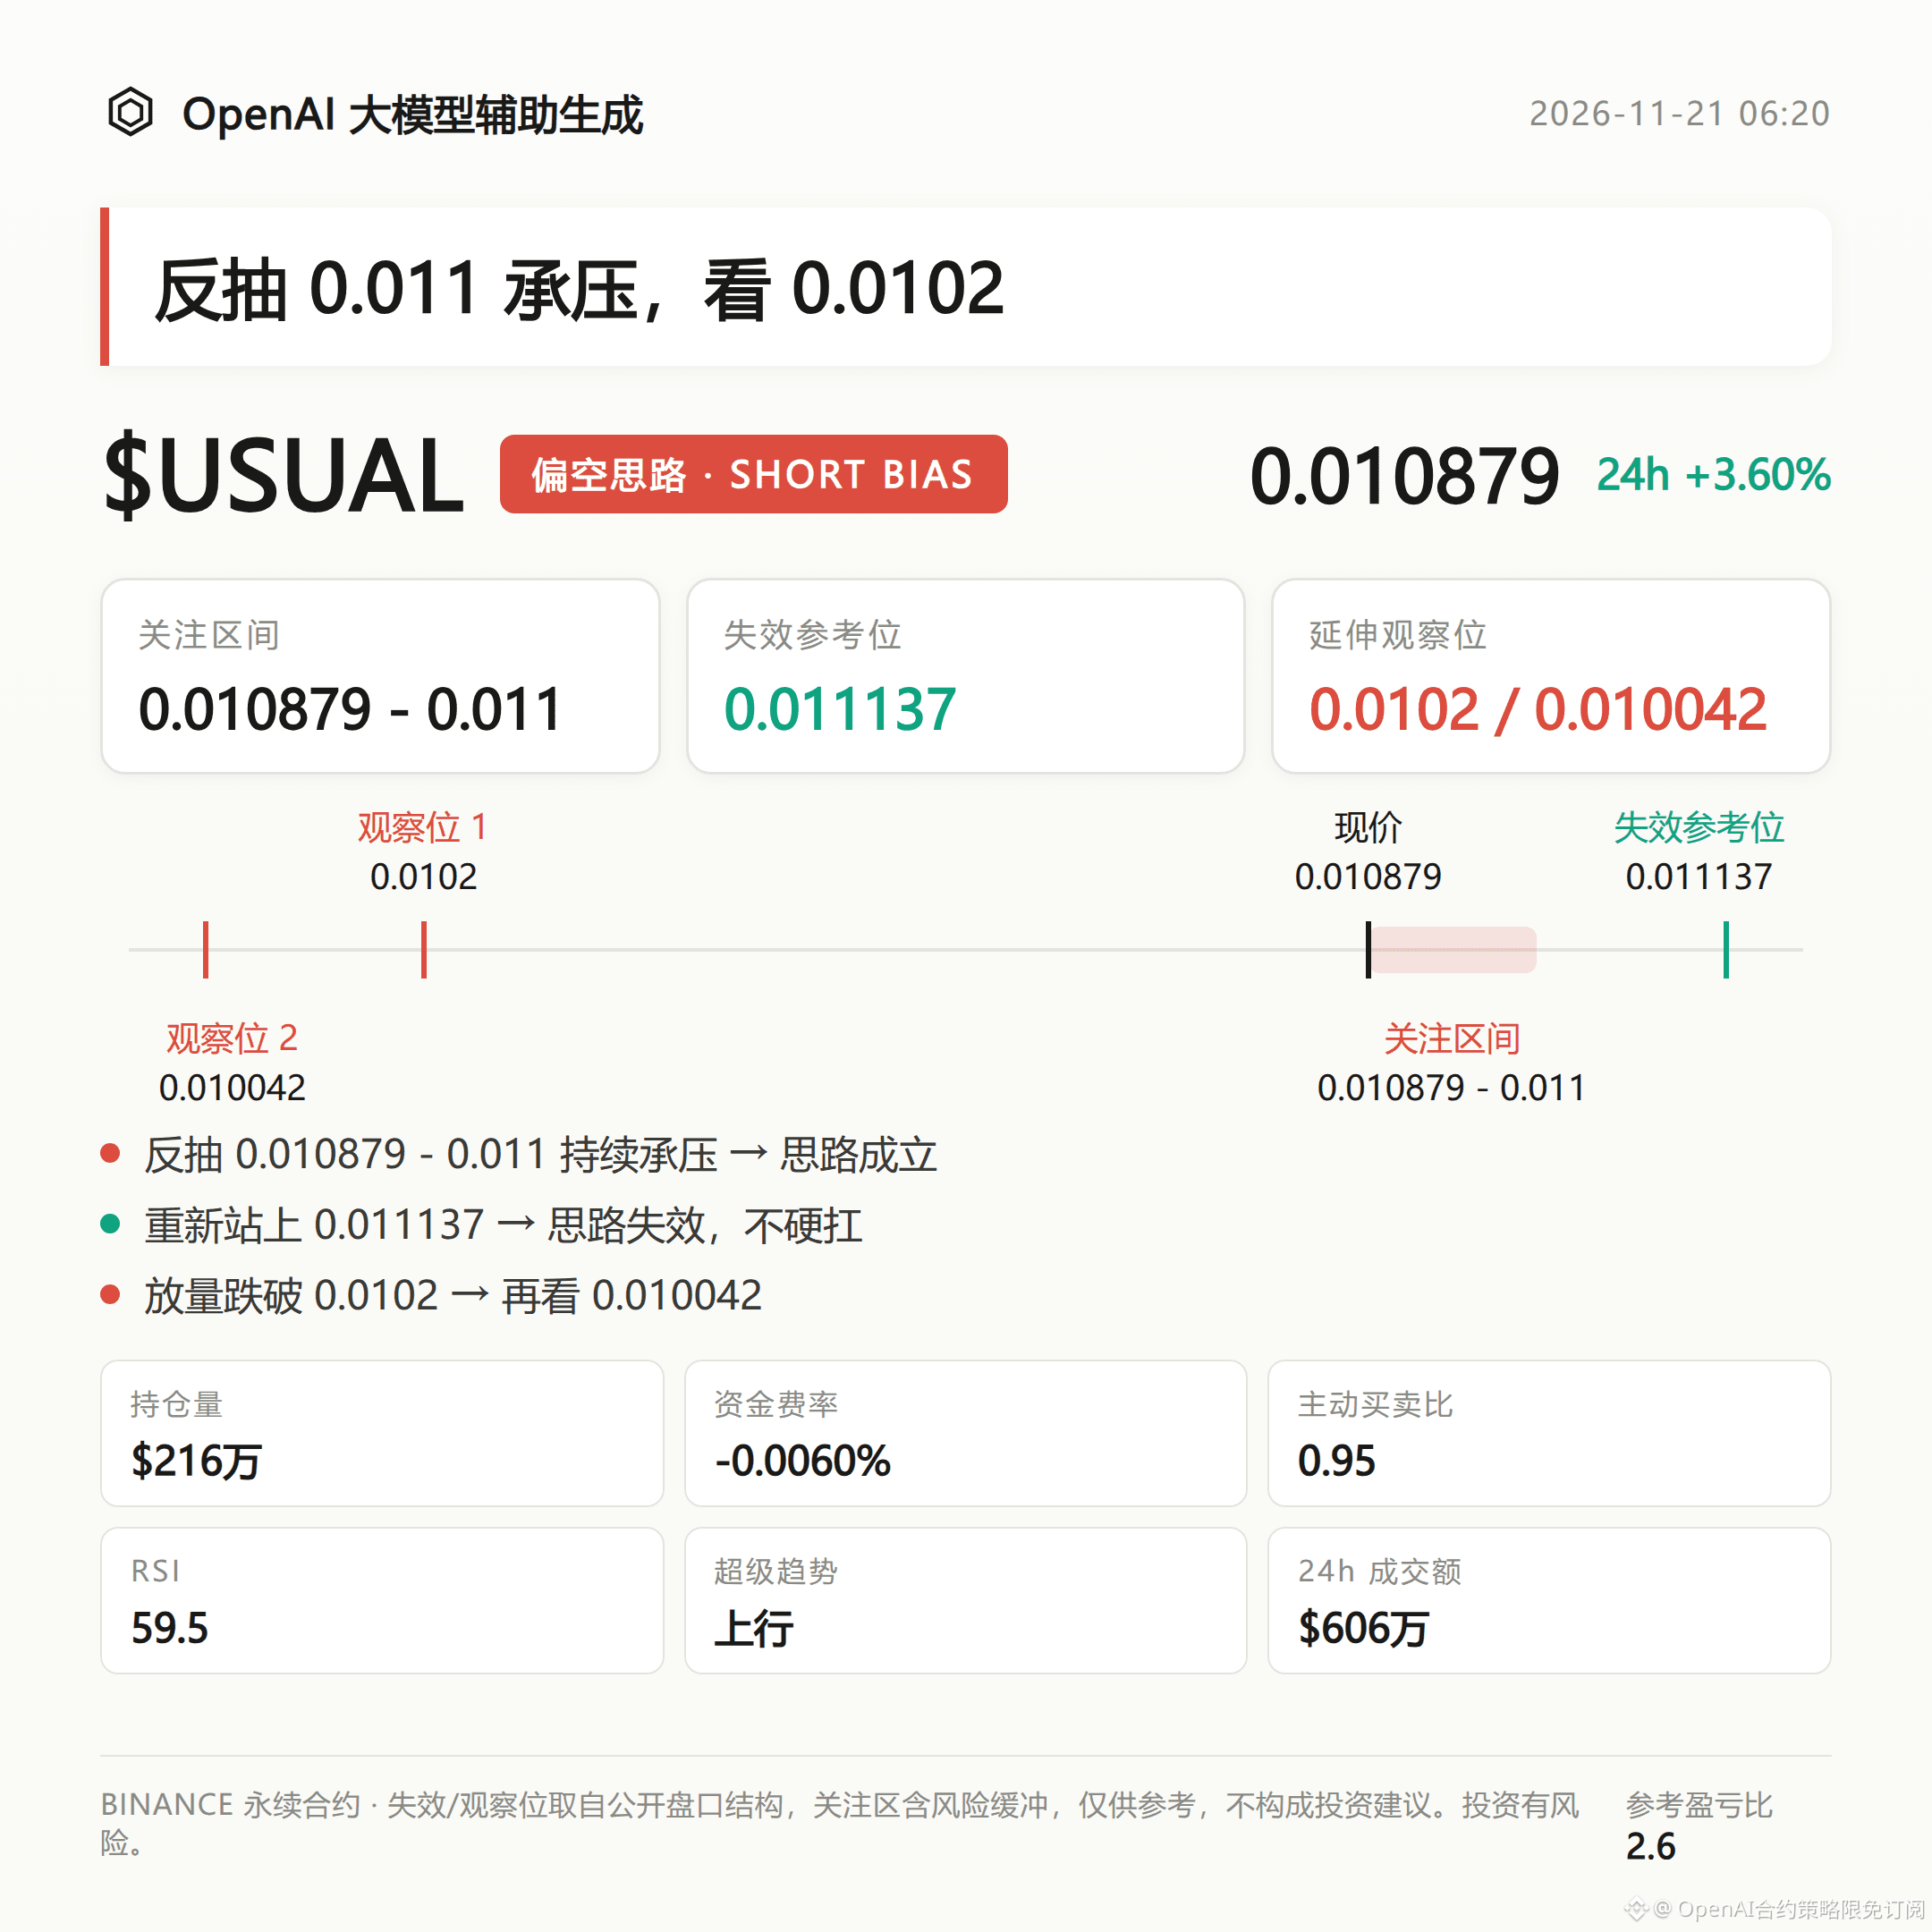
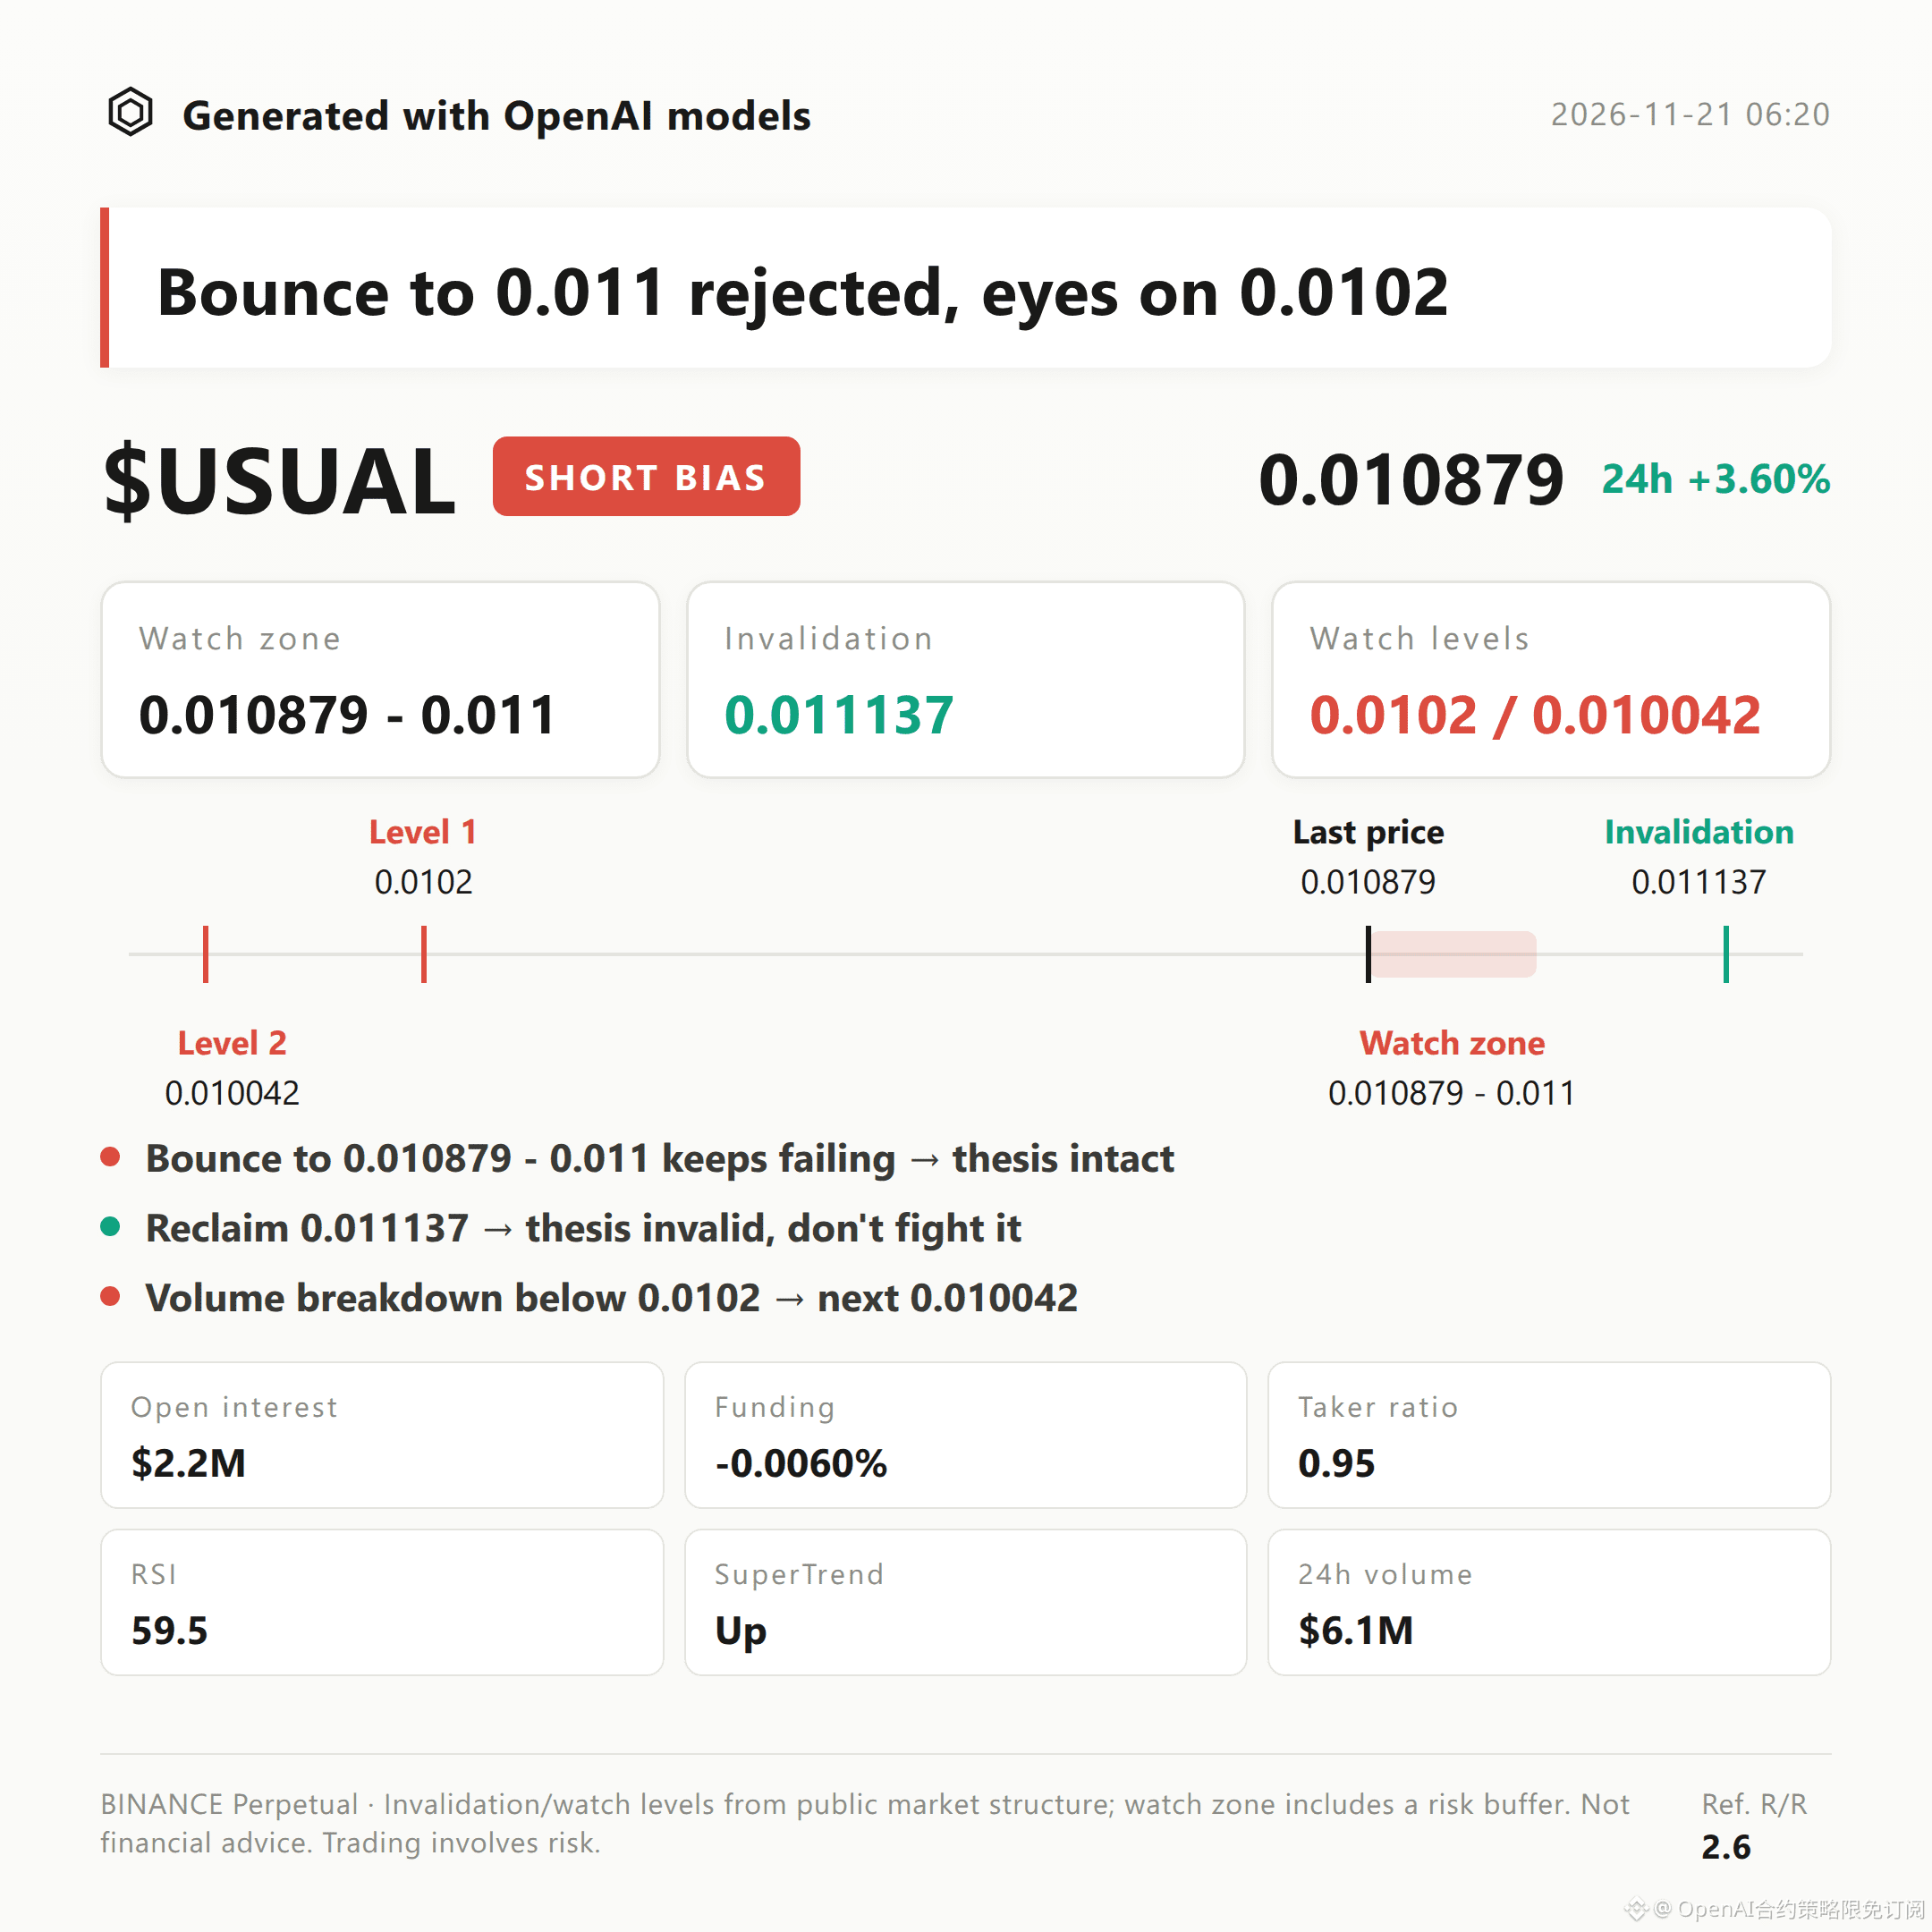
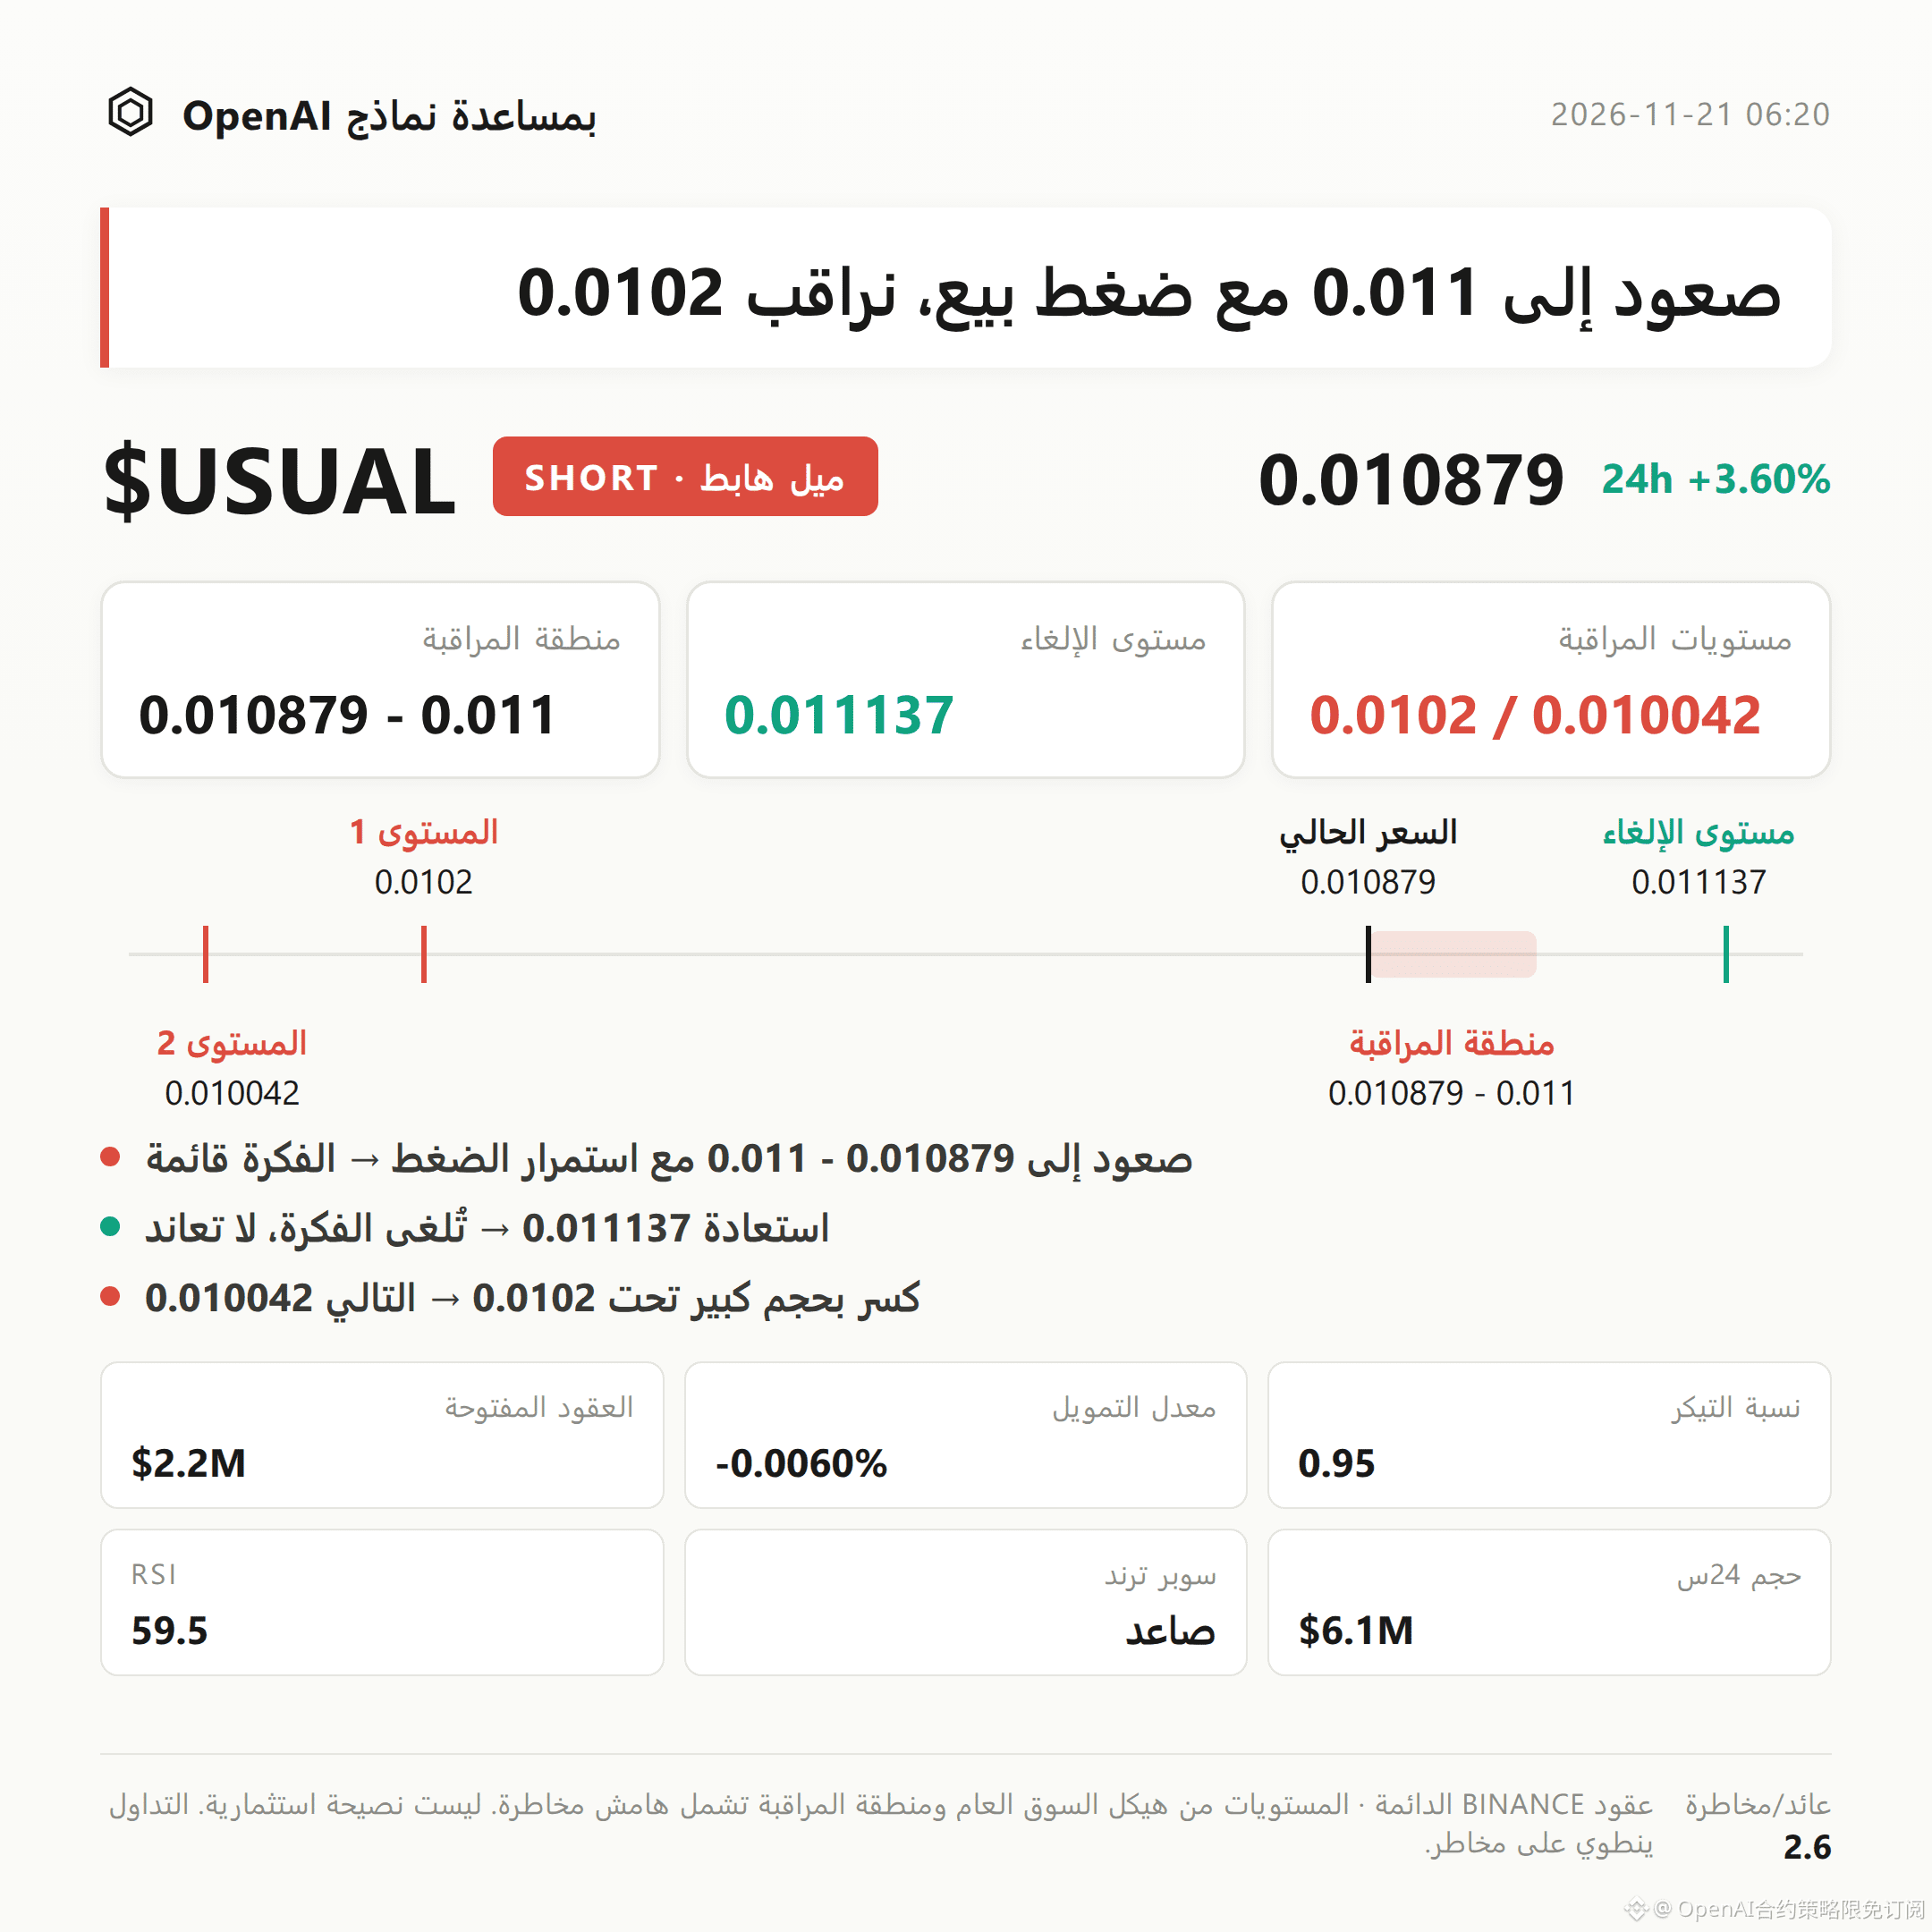
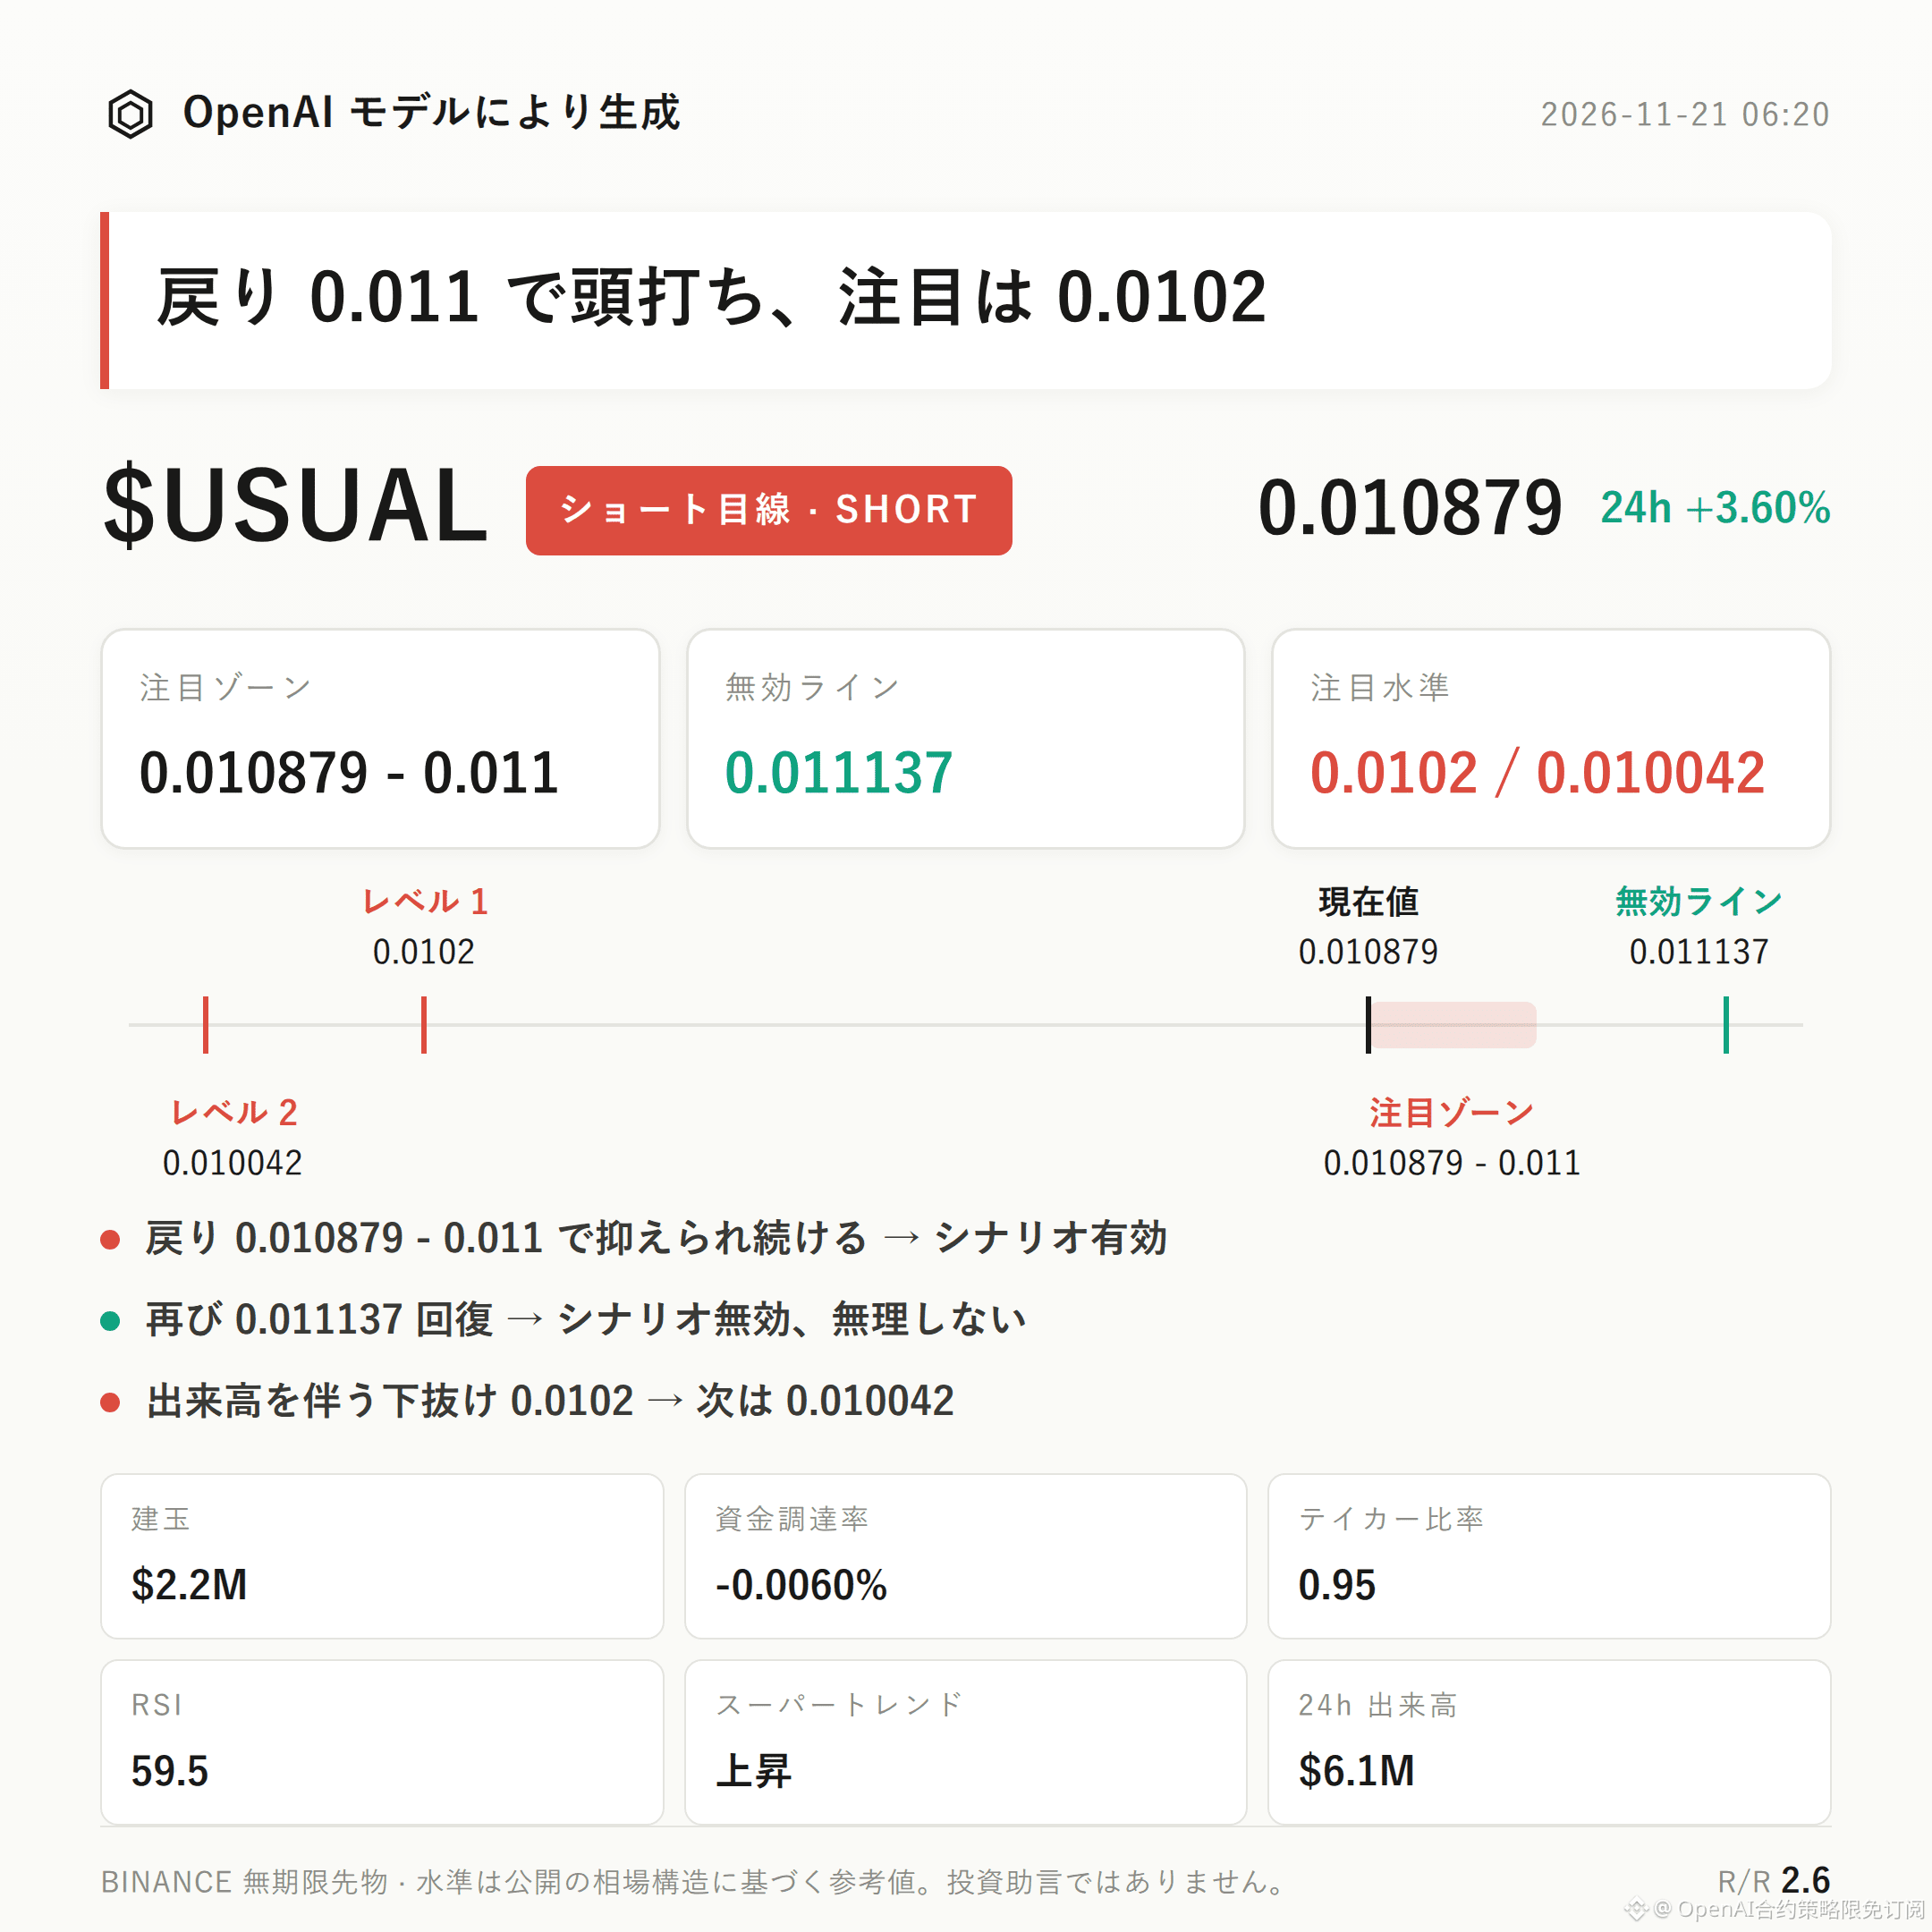
$USUAL Bearish Bias | Watch Zone 0.010879 - 0.011 | Invalidation Reference 0.011137 | Observation Levels 0.0102 / 0.010042
The current bearish bias for $USUAL is predicated on price meeting resistance in the resistance zone.
The key rationale is that the taker buy/sell ratio of 0.95 indicates selling pressure is dominant, 57% of accounts are long, and the current price of 0.010879 has entered the resistance reference zone.
The key is to watch whether a rebound is capped in the resistance zone, with a move back above 0.011137 serving as confirmation.
The current price is above the Bollinger midline at 0.0106 and close to the upper band at 0.011. The recent high of 0.011137 serves as a higher structural resistance reference.
However, Supertrend remains bullish, RSI is 59.5, and MACD continues to show bullish momentum. This means the bearish bias still requires price confirmation and should not be treated as a fully established downtrend.
24-hour trading volume is $6.06 million, while open interest is $2.16 million, up 3.9%, indicating increased market participation.
The taker buy/sell ratio of 0.95 favors sellers, while 57% of accounts are long, creating conditions to watch for a pullback after a concentration of long positions.
However, the 24-hour gain is 3.60%, and the funding rate is -0.0060%. The price rise alongside increased open interest is itself counterevidence to the bearish bias.
For shorts, first watch the 0.010879 - 0.011 zone; it is preferable to wait for confirmation after a rebound meets resistance.
If price retests or rebounds into this zone, encounters selling pressure, and is capped again, the bearish bias is supported. If price moves back above 0.011137, the current pullback structure is invalidated and the bearish bias no longer applies—do not overstay.
If price breaks below 0.0102 on increased volume, then watch support near 0.010042. If 0.0102 is not decisively broken, the potential for further downside remains uncertain.
The reference risk/reward ratio is 2.6 and is only intended to assess whether the current structure is worth continuing to monitor.
The main evidence against the bearish view is the rising Supertrend, sustained bullish MACD momentum, RSI at 59.5, and a 3.60% 24-hour gain alongside a 3.9% increase in open interest; beyond these, there are no more significant counter-signals at this time.
Leverage in futures trading is inherently risky; position discipline matters more than directional bias.
For reference only; this does not constitute investment advice. Futures involve leverage, and investing carries risk.
This article was generated with the assistance of an OpenAI large language model.
$USUAL and #FuturesAnalysis
$USUAL Bearish Bias | Watch Zone 0.010879 - 0.011 | Invalidation Reference 0.011137 | Observation Levels 0.0102 / 0.010042
The current bearish bias for $USUAL is predicated on price meeting resistance in the resistance zone.
The key rationale is that the taker buy/sell ratio of 0.95 indicates selling pressure is dominant, 57% of accounts are long, and the current price of 0.010879 has entered the resistance reference zone.
The key is to watch whether a rebound is capped in the resistance zone, with a move back above 0.011137 serving as confirmation.
The current price is above the Bollinger midline at 0.0106 and close to the upper band at 0.011. The recent high of 0.011137 serves as a higher structural resistance reference.
However, Supertrend remains bullish, RSI is 59.5, and MACD continues to show bullish momentum. This means the bearish bias still requires price confirmation and should not be treated as a fully established downtrend.
24-hour trading volume is $6.06 million, while open interest is $2.16 million, up 3.9%, indicating increased market participation.
The taker buy/sell ratio of 0.95 favors sellers, while 57% of accounts are long, creating conditions to watch for a pullback after a concentration of long positions.
However, the 24-hour gain is 3.60%, and the funding rate is -0.0060%. The price rise alongside increased open interest is itself counterevidence to the bearish bias.
For shorts, first watch the 0.010879 - 0.011 zone; it is preferable to wait for confirmation after a rebound meets resistance.
If price retests or rebounds into this zone, encounters selling pressure, and is capped again, the bearish bias is supported. If price moves back above 0.011137, the current pullback structure is invalidated and the bearish bias no longer applies—do not overstay.
If price breaks below 0.0102 on increased volume, then watch support near 0.010042. If 0.0102 is not decisively broken, the potential for further downside remains uncertain.
The reference risk/reward ratio is 2.6 and is only intended to assess whether the current structure is worth continuing to monitor.
The main evidence against the bearish view is the rising Supertrend, sustained bullish MACD momentum, RSI at 59.5, and a 3.60% 24-hour gain alongside a 3.9% increase in open interest; beyond these, there are no more significant counter-signals at this time.
Leverage in futures trading is inherently risky; position discipline matters more than directional bias.
For reference only; this does not constitute investment advice. Futures involve leverage, and investing carries risk.
This article was generated with the assistance of an OpenAI large language model.
$USUAL and #FuturesAnalysis