Chan Theory basics: using MACD as an aid to analysis.
The MACD’s yellow and white lines and histogram area are commonly used to gauge momentum. If the price makes a new high while the histogram area shrinks, that’s direct evidence of weakening momentum.
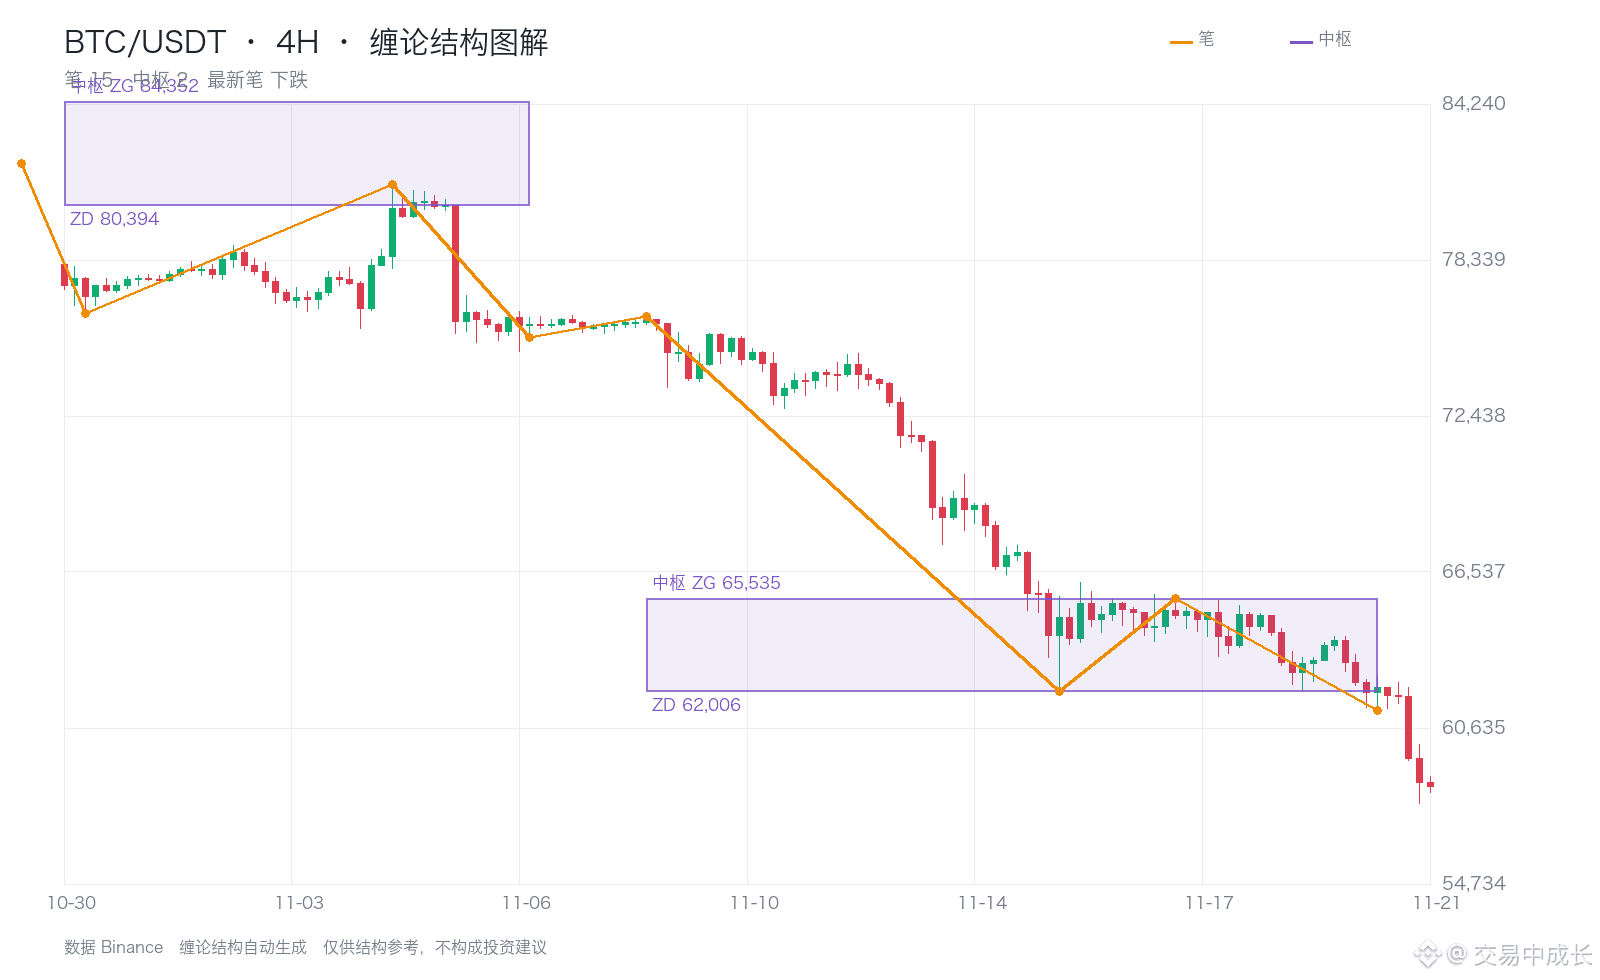
Compare this with the current 4-hour BTC chart: the central range is 62,006–65,535, and the price is below it.
It’s far more useful to connect the concepts to the current chart than to memorize definitions.
$BTC $ETH #缠论 #预测市场 #BitcoinNewLow
The MACD’s yellow and white lines and histogram area are commonly used to gauge momentum. If the price makes a new high while the histogram area shrinks, that’s direct evidence of weakening momentum.
Compare this with the current 4-hour BTC chart: the central range is 62,006–65,535, and the price is below it.
It’s far more useful to connect the concepts to the current chart than to memorize definitions.
$BTC $ETH #缠论 #预测市场 #BitcoinNewLow