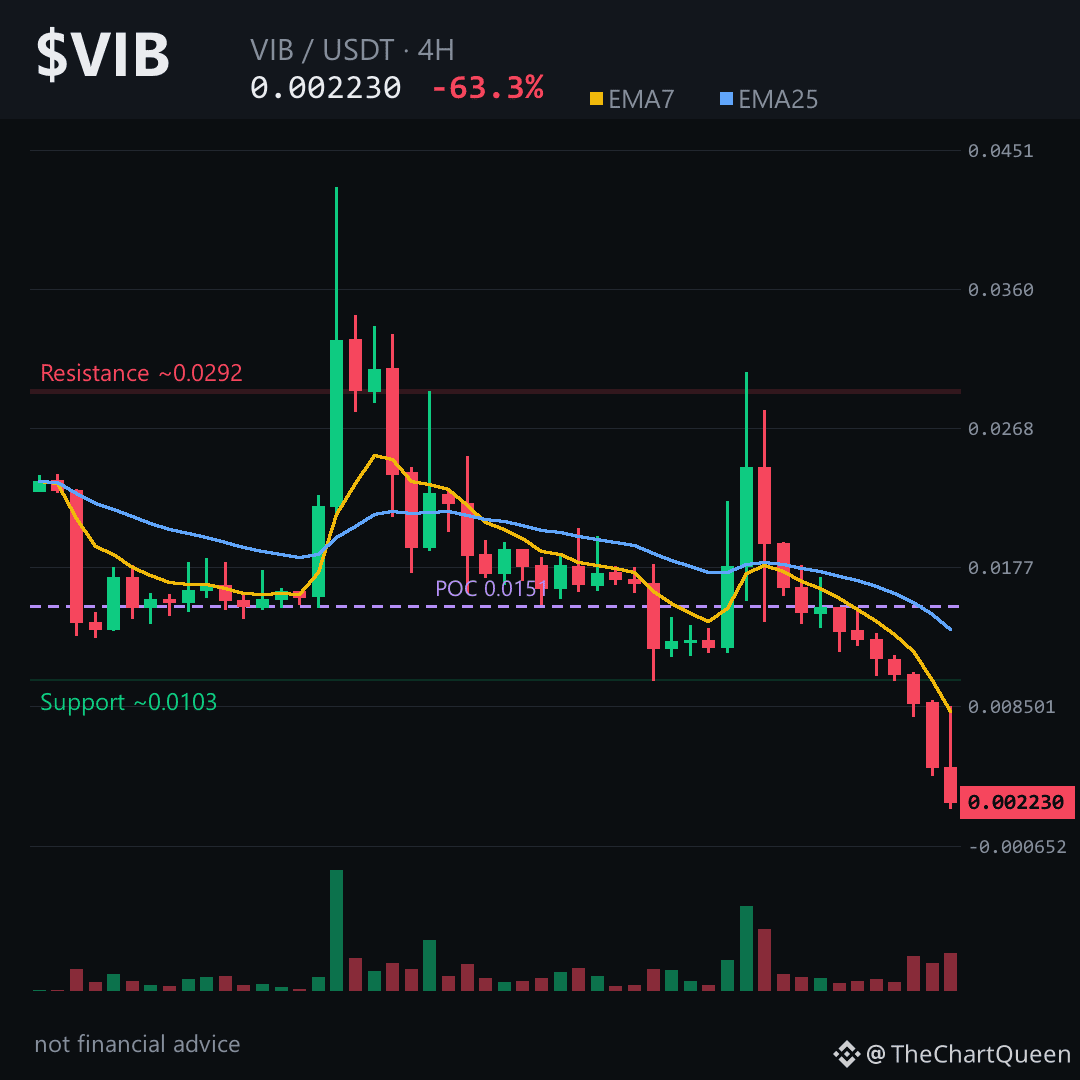
Why is $VIB slipping under its 4‑hour pivot while the bears keep tightening? 👀
Read the hidden clue before you scroll past 👇
Price looks bearish, and the internals whisper a deeper sell‑off: EMA7 is well below EMA25, RSI sits in the 28‑zone, and an unmitigated bearish FVG sits right above the current price. With zero funding and no open interest, there’s little short‑covering pressure left.
On the 4‑hour chart the key zones are:
– **Pivot zone** around 0.00224 (where price is now).
– **Invalidation zone** near 0.00235 – a close above this level would wipe out the bearish bias.
– **Objective zone** around 0.00204 – a break below could push the move toward the 0.0019 area.
I read the chart as pointing to further downside; the real risk is a bounce that manages to stay above the ~0.00235 ceiling.
Follow me for the next update when $VIB either cracks the ~0.00204 floor or defends the ~0.00235 ceiling.
What level are you watching on $VIB? 👇
⚠️ Not financial advice. DYOR.
#VIB #Crypto #BinanceSquare #TopLoser
Read the hidden clue before you scroll past 👇
Price looks bearish, and the internals whisper a deeper sell‑off: EMA7 is well below EMA25, RSI sits in the 28‑zone, and an unmitigated bearish FVG sits right above the current price. With zero funding and no open interest, there’s little short‑covering pressure left.
On the 4‑hour chart the key zones are:
– **Pivot zone** around 0.00224 (where price is now).
– **Invalidation zone** near 0.00235 – a close above this level would wipe out the bearish bias.
– **Objective zone** around 0.00204 – a break below could push the move toward the 0.0019 area.
I read the chart as pointing to further downside; the real risk is a bounce that manages to stay above the ~0.00235 ceiling.
Follow me for the next update when $VIB either cracks the ~0.00204 floor or defends the ~0.00235 ceiling.
What level are you watching on $VIB? 👇
⚠️ Not financial advice. DYOR.
#VIB #Crypto #BinanceSquare #TopLoser