$SOL 🚀🔥 Why do I think the market could move higher in the coming days? 📈
I've been studying charts for the past couple of years, and that experience has taught me some valuable lessons.
Here's an interesting pattern I've noticed:
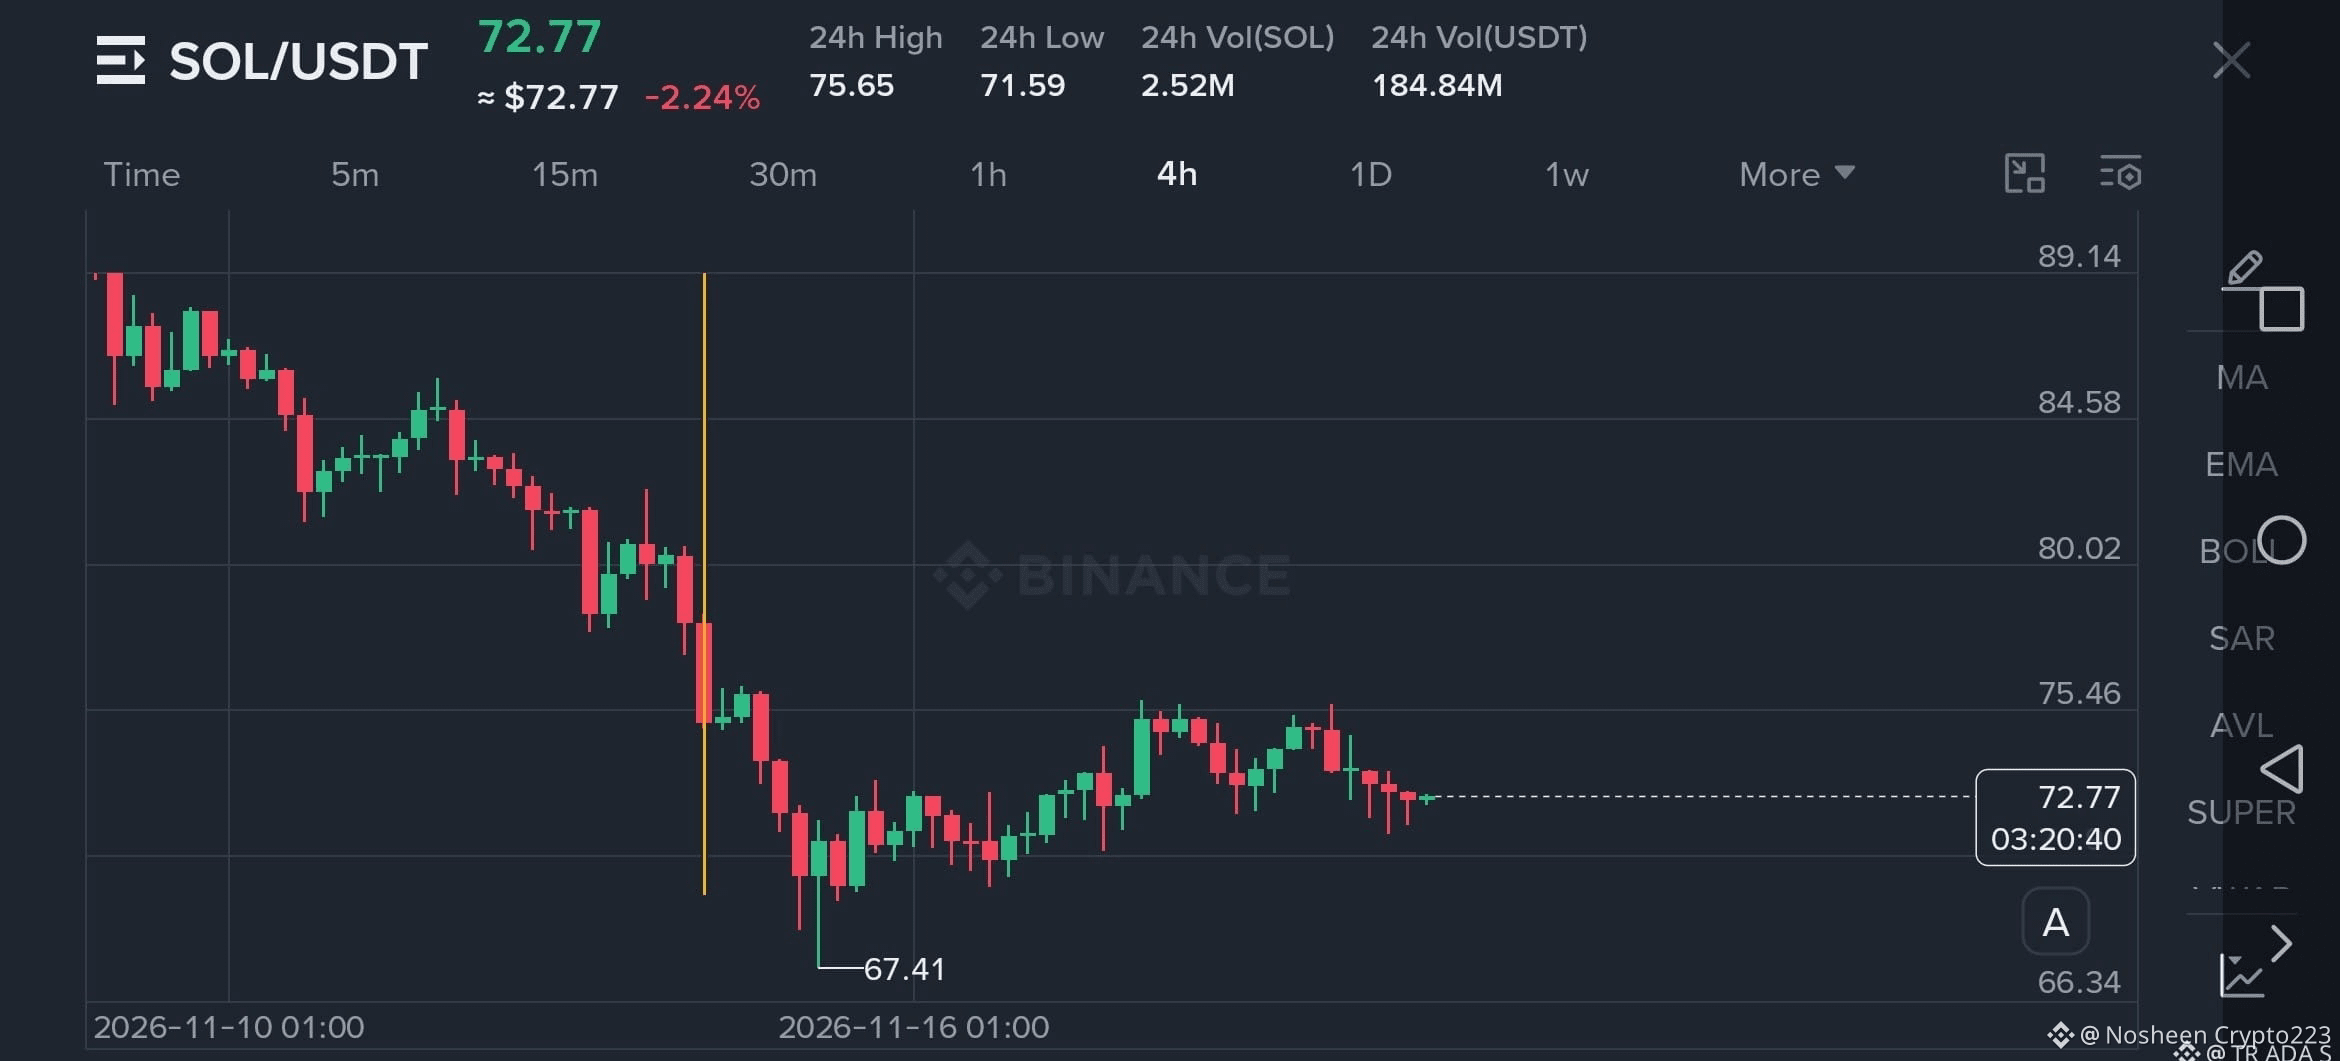
1️⃣ On the left is the $SOL chart, which has recently formed a Hammer candlestick followed by a Bullish Engulfing pattern. 🟢
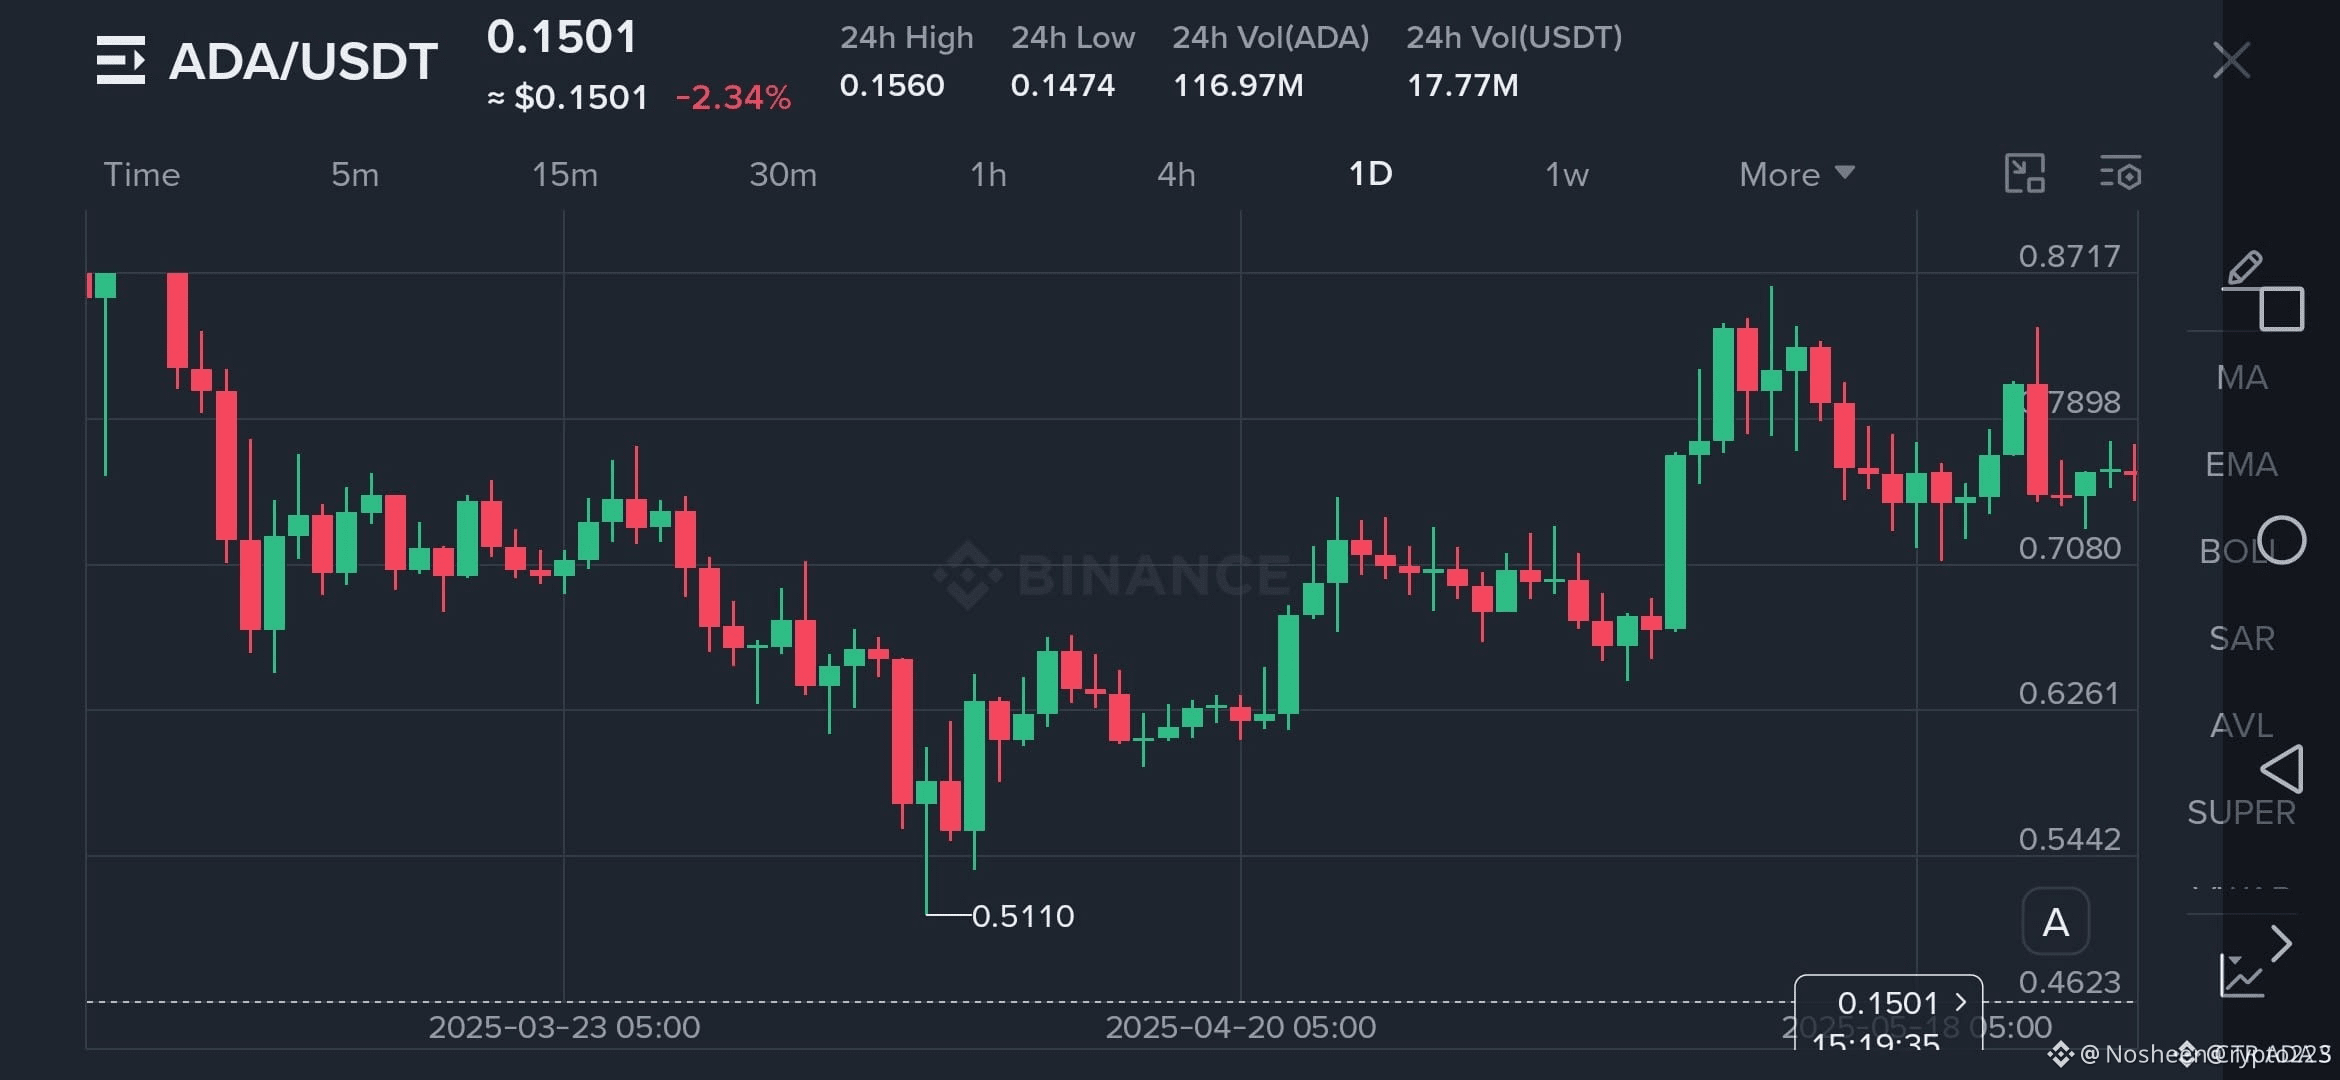
2️⃣ On the right is the $ADA chart from almost a year ago. It formed the exact same pattern: a Hammer followed by a Bullish Engulfing candle. Shortly afterward, $ADA made a beautiful move to the upside! 🚀
Could $SOL be setting up for a similar move? 👀
My strategy:
📍 Consider placing your Stop Loss (SL) below the Hammer's low.
📈 Look for a potential buying opportunity after confirmation.
History doesn't always repeat itself, but similar patterns are definitely worth watching!
Stay alert, manage your risk, and trade smart! 💎🔥
I've been studying charts for the past couple of years, and that experience has taught me some valuable lessons.
Here's an interesting pattern I've noticed:
1️⃣ On the left is the $SOL chart, which has recently formed a Hammer candlestick followed by a Bullish Engulfing pattern. 🟢
2️⃣ On the right is the $ADA chart from almost a year ago. It formed the exact same pattern: a Hammer followed by a Bullish Engulfing candle. Shortly afterward, $ADA made a beautiful move to the upside! 🚀
Could $SOL be setting up for a similar move? 👀
My strategy:
📍 Consider placing your Stop Loss (SL) below the Hammer's low.
📈 Look for a potential buying opportunity after confirmation.
History doesn't always repeat itself, but similar patterns are definitely worth watching!
Stay alert, manage your risk, and trade smart! 💎🔥