
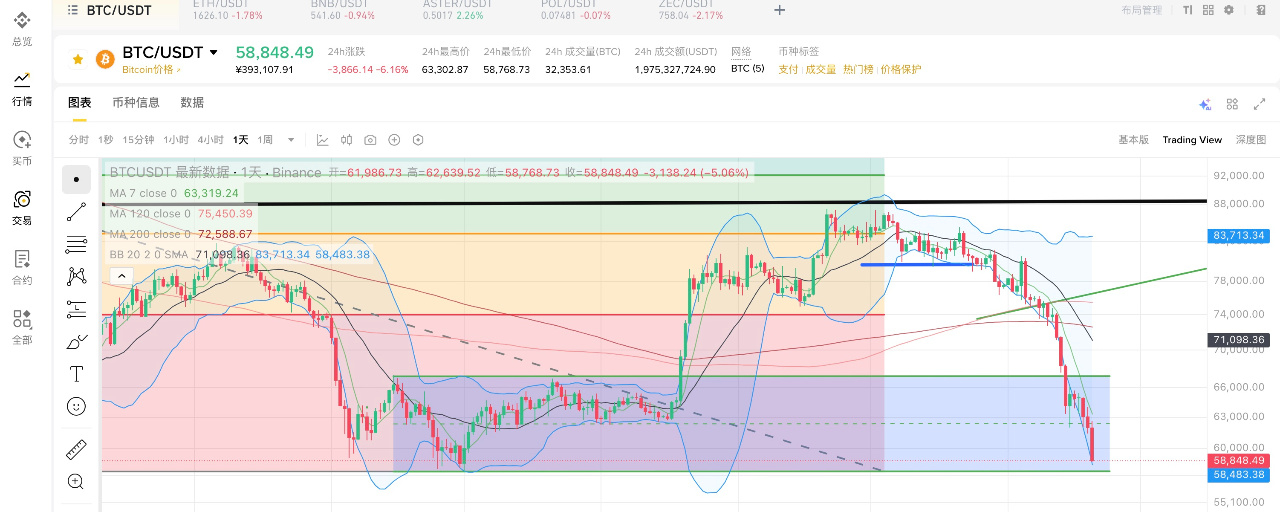

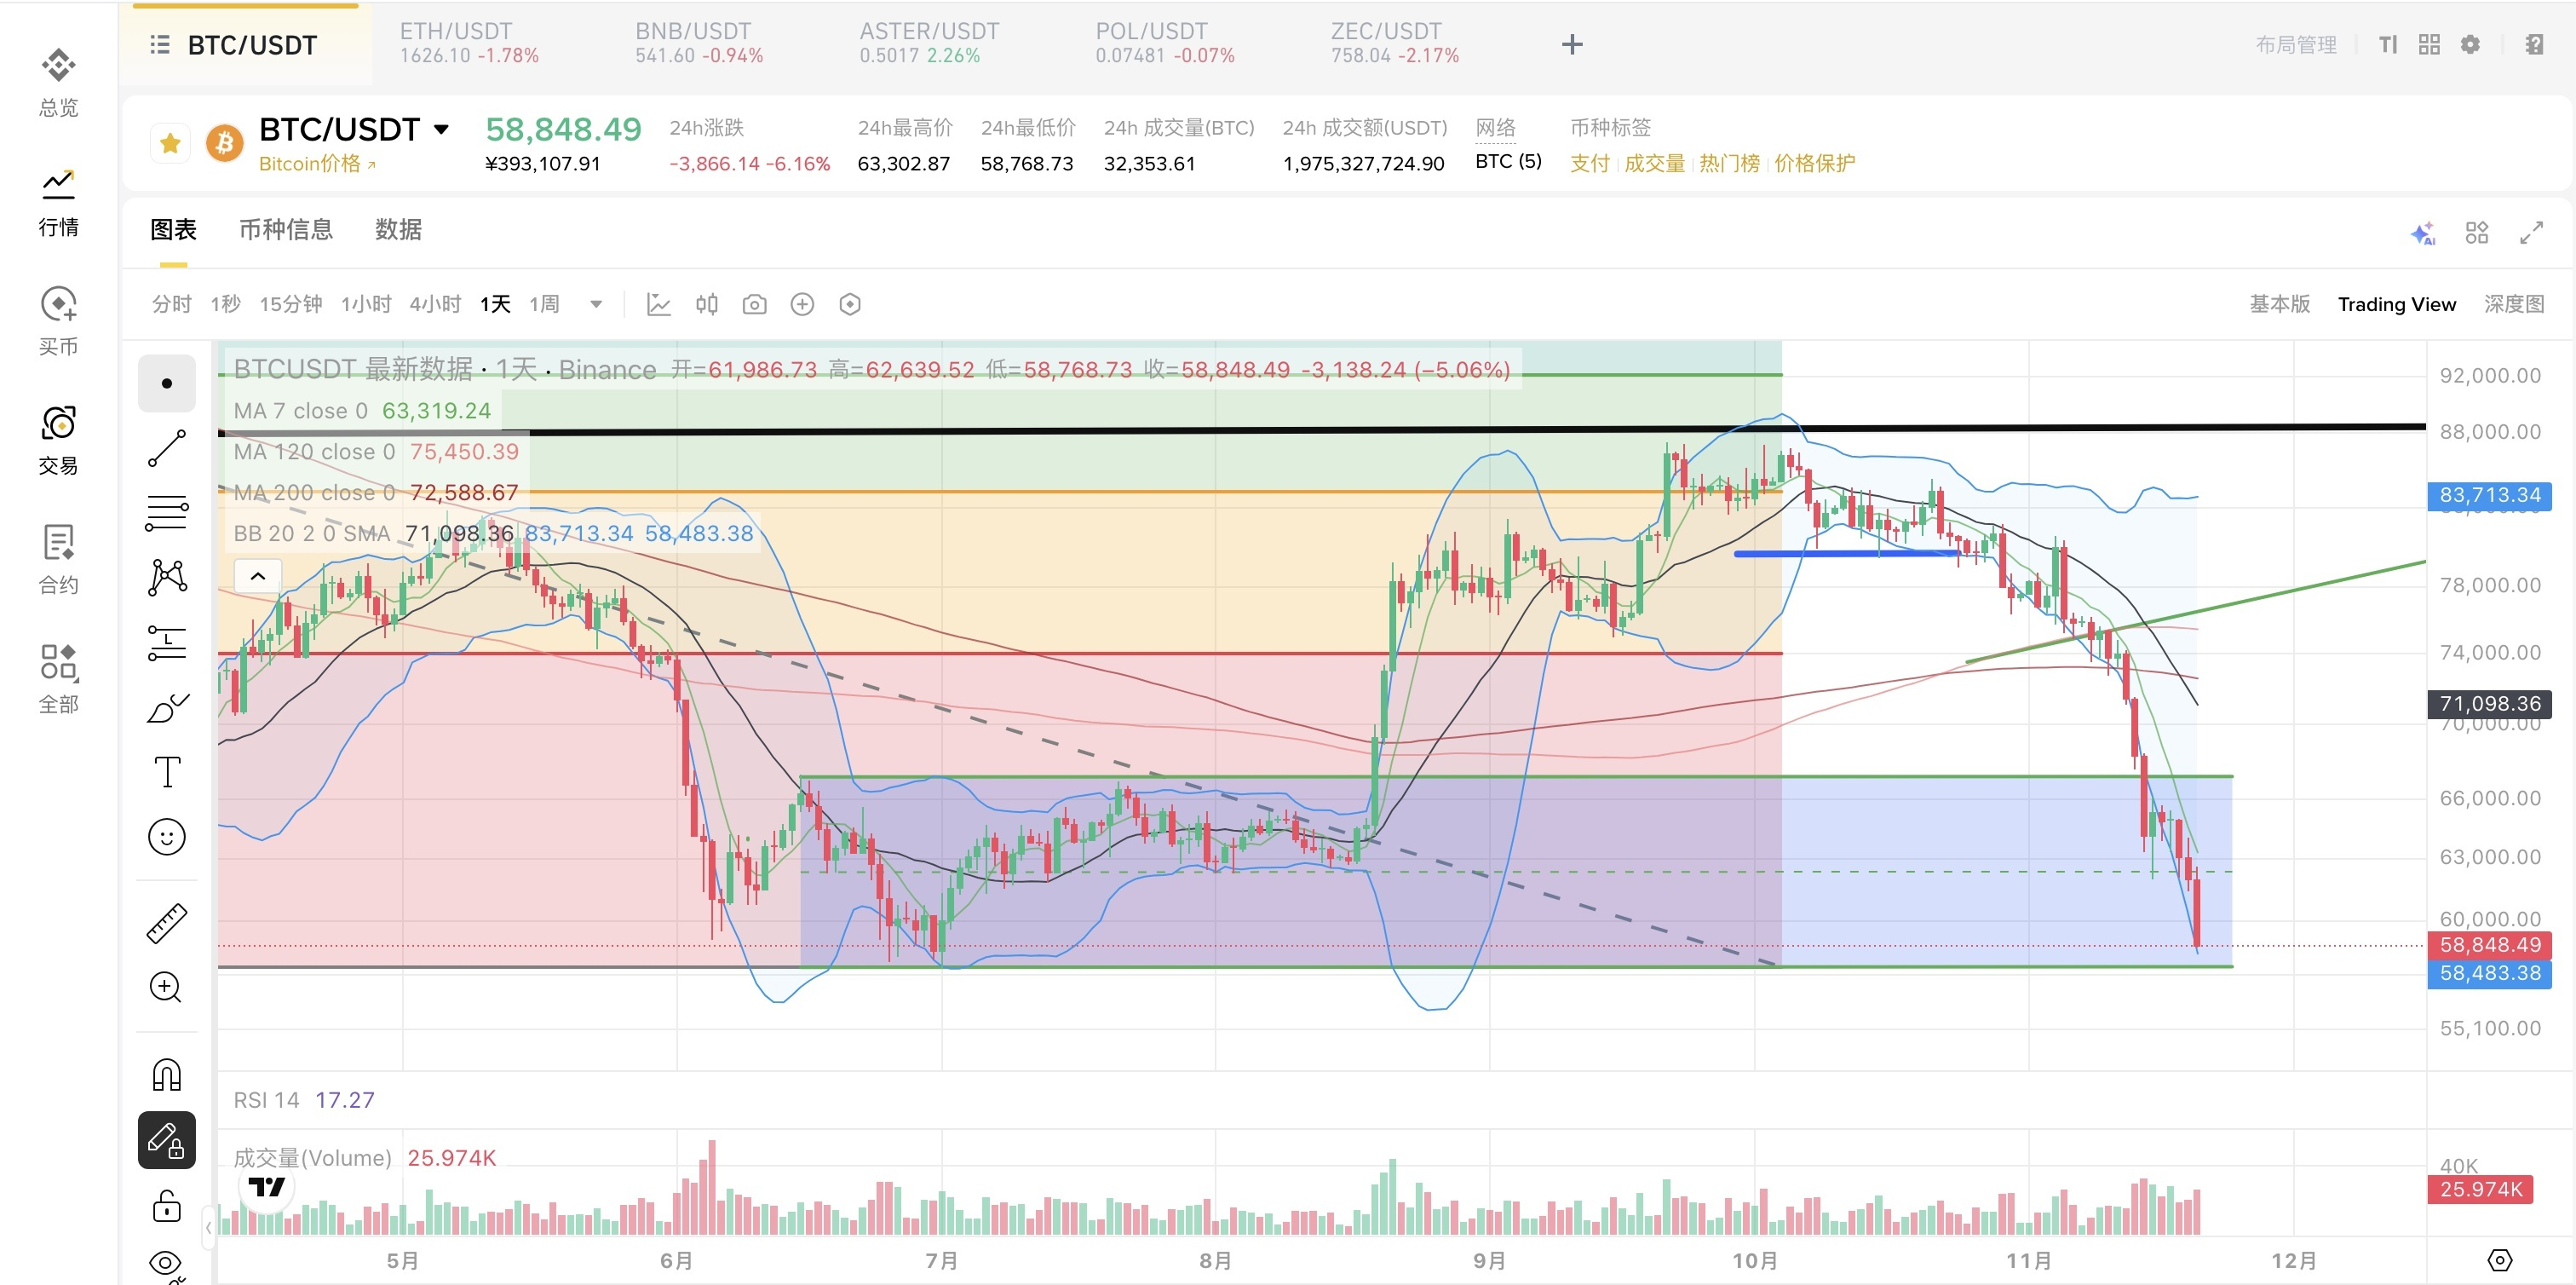
57,900—the last fig leaf for #Bitcoin! First watch, then wait, then endure!
Honestly, things don’t look very promising for #BTC right now. A sharp drop isn’t what worries me; it’s this kind of slow decline—grinding away at buy orders and eroding everyone’s confidence.
From the charts, breaking below 57,900 to a new low will further undermine market confidence and may even trigger more selling pressure. There was a bottoming signal on the hourly chart early this week, but unfortunately it didn’t carry over to the daily chart, and the decline continued.
On the macro front, the rate-hike cycle is back. AI-related developments in U.S. stocks have dented confidence in risk investments, drawing money toward the more stable returns of U.S. Treasuries. As a result, BTC broke below the key $63,000–$65,000 cost-basis zone, and even slipped smoothly below $60,000.
On the data: #比特币跌破6万美元,短期能否企稳反弹?
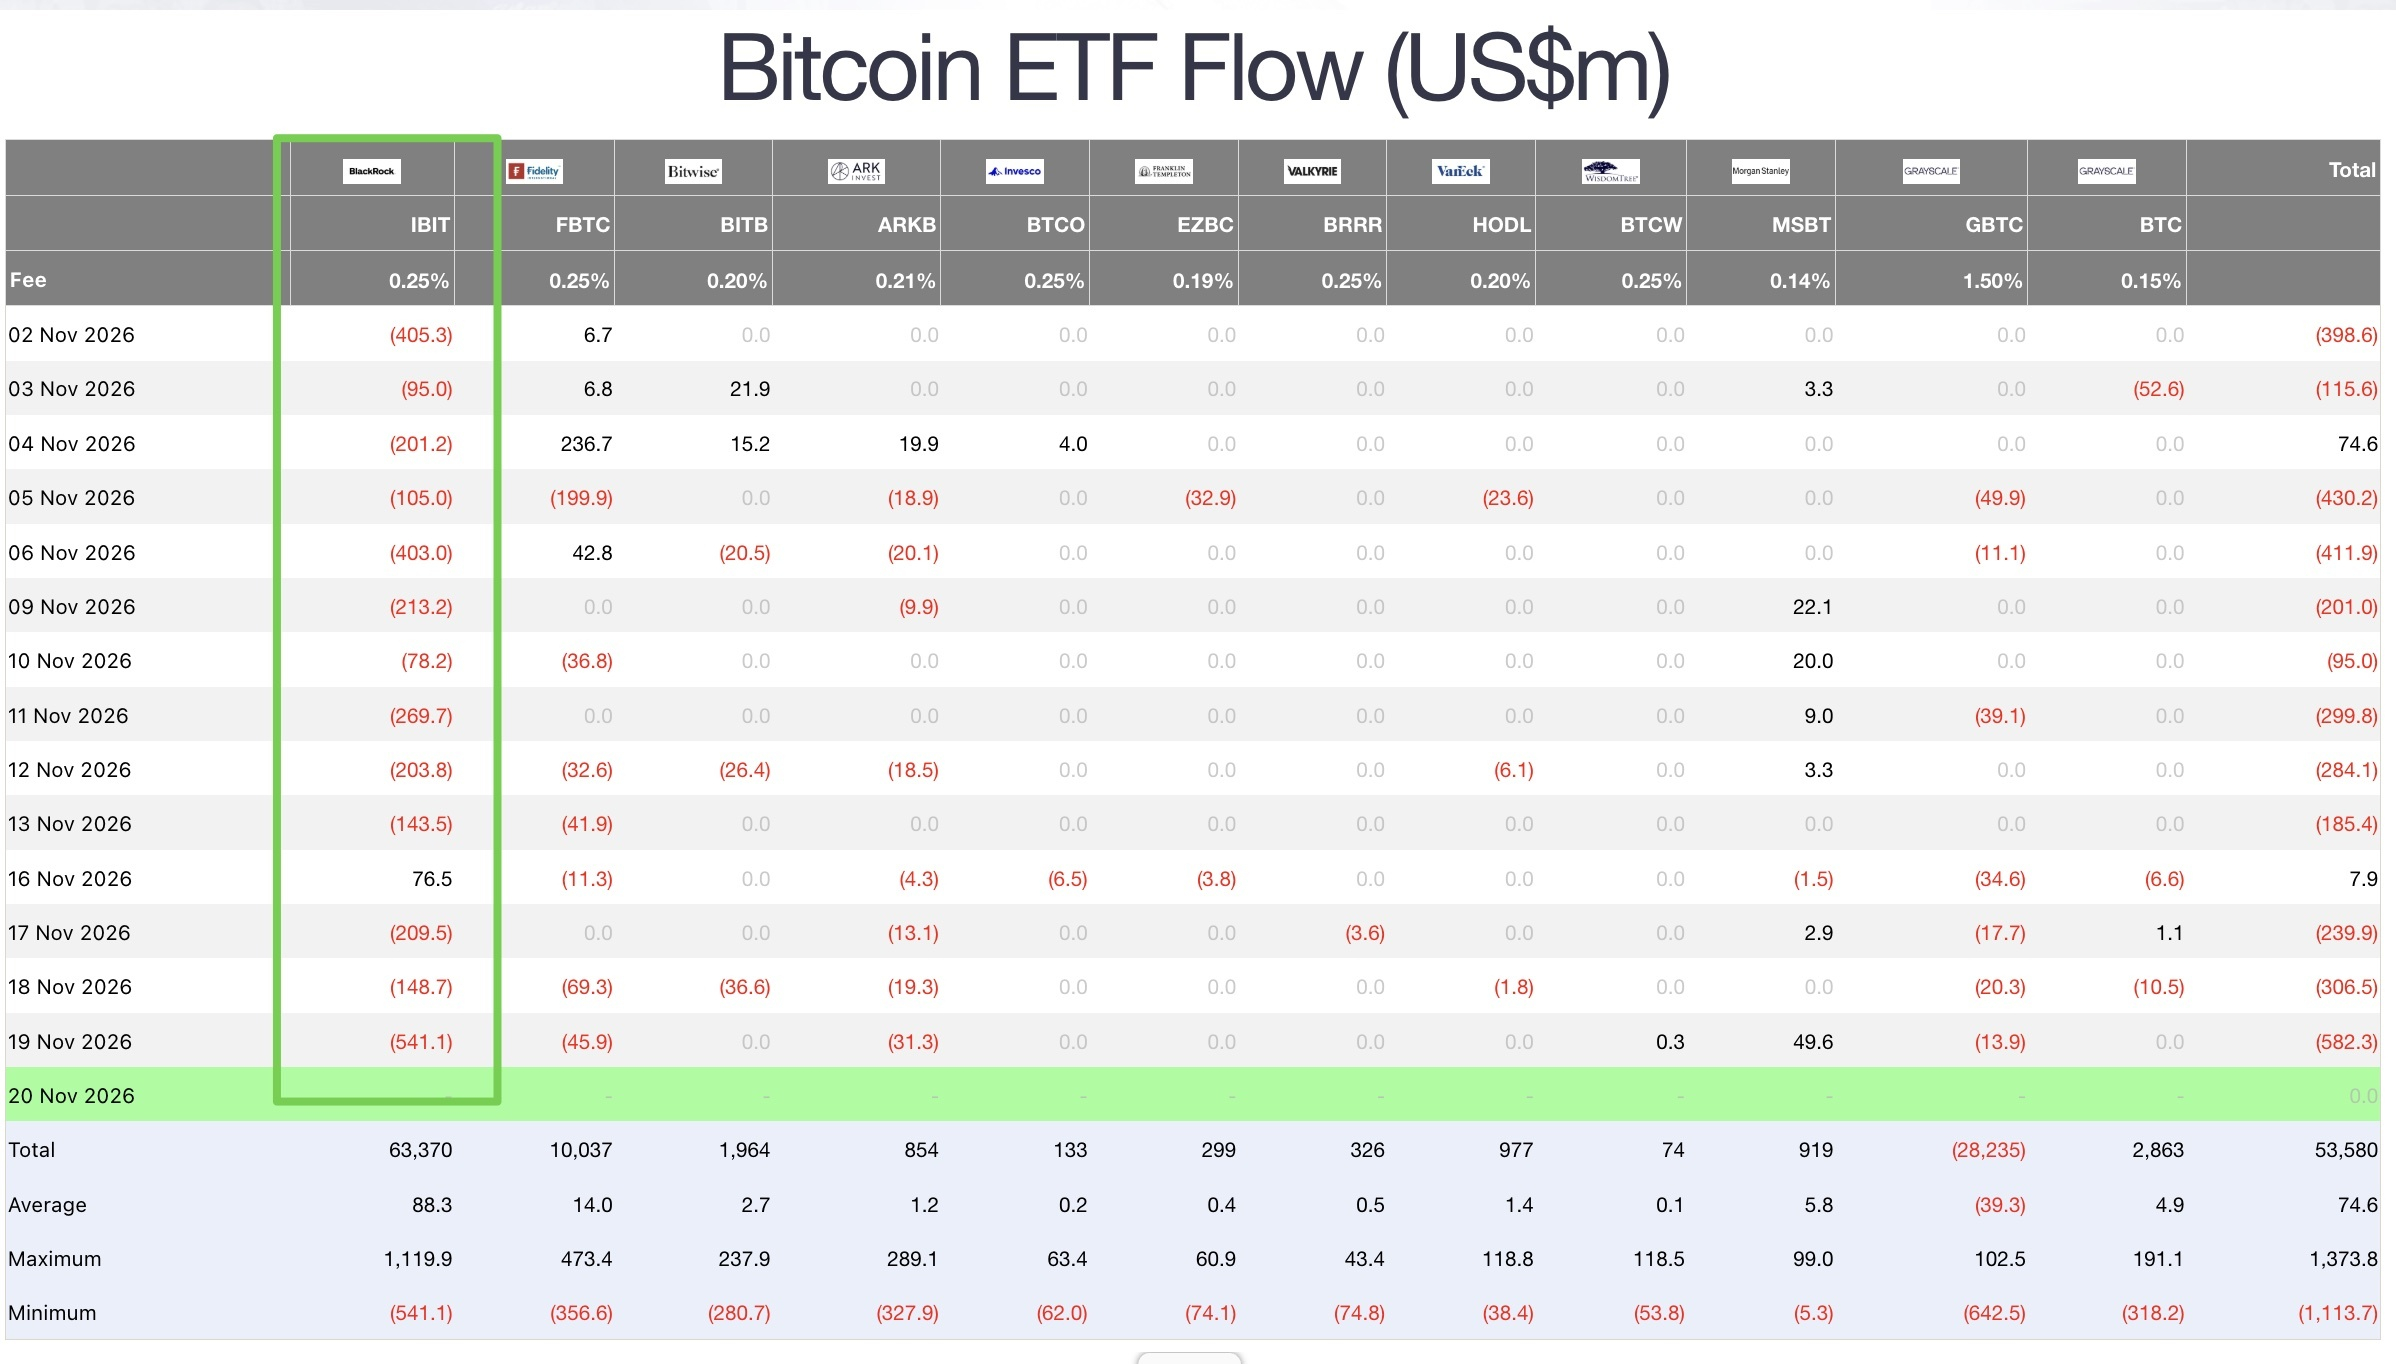
After a small net inflow on Monday, the BTC ETFs quickly returned to persistent net outflows. IBIT, once the biggest ETF buyer, has instead become the biggest source of selling pressure,
with not only continued net outflows, but also a massive $541 million in ETF outflows on Thursday. This marks three consecutive weeks of sustained outflows from IBIT.
Over the past three weeks, total net outflows from ETFs have reached $3.468 billion. IBIT has seen sustained net outflows of $2.941 billion, accounting for 84.8% of total net outflows. Behind these figures is the collapse of institutional investors’ confidence.
One week of net outflows could be portfolio rotation, but after three consecutive weeks of accelerating outflows, it’s hard to explain them as rotation. This is also what worries me most.
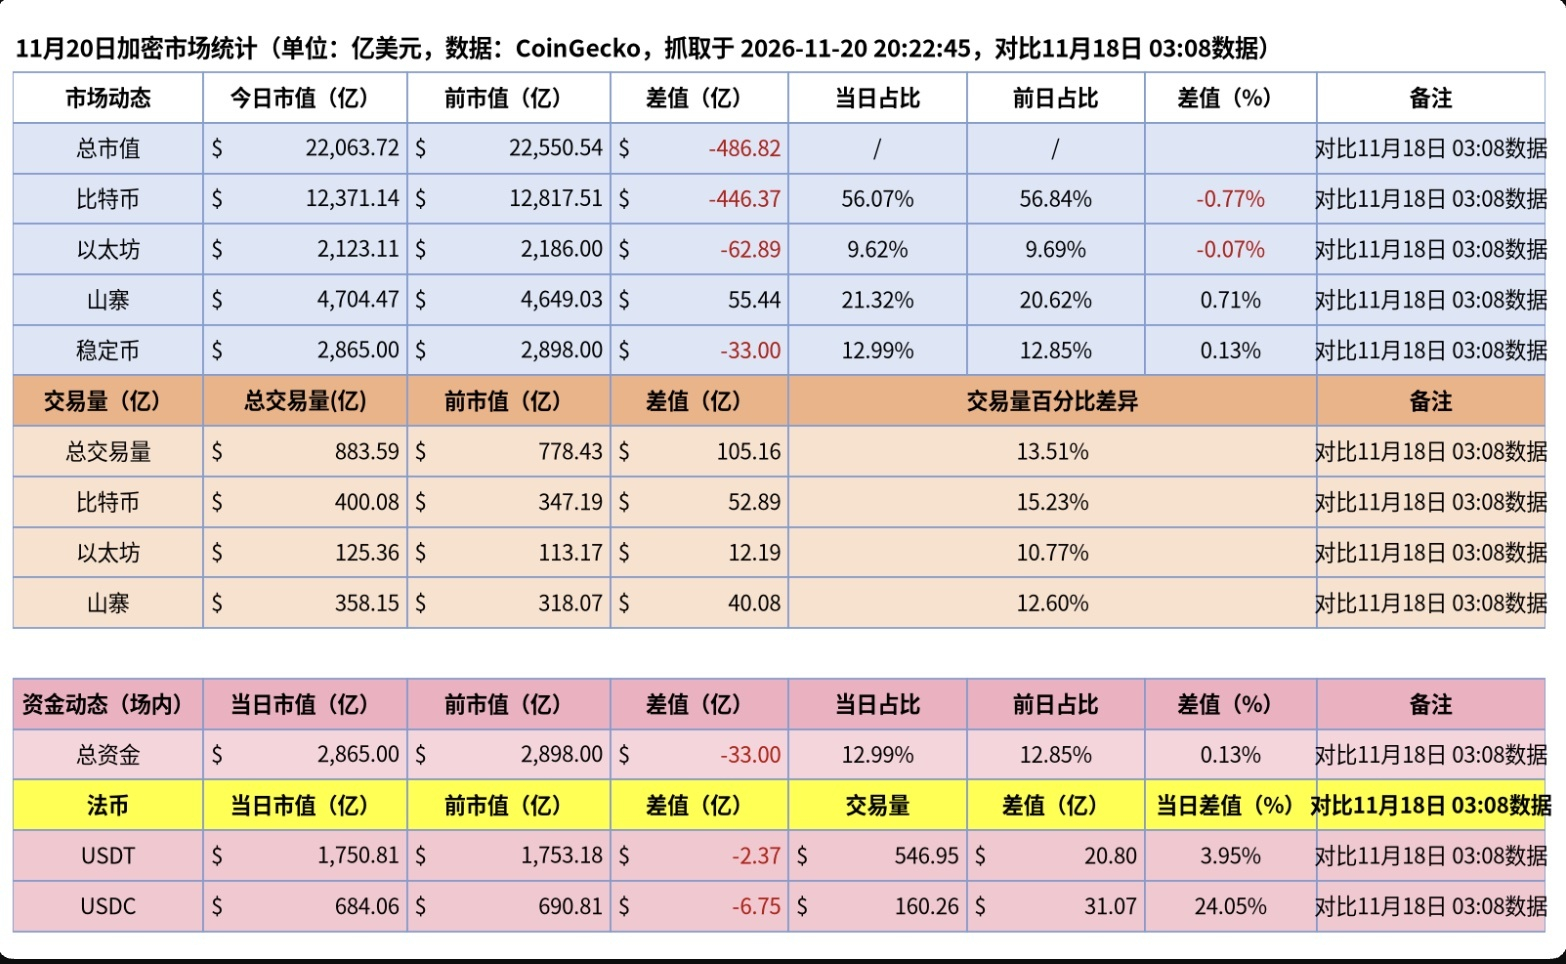
Looking at domestic crypto-market data, there have been $3.3 billion in net outflows since November 18. Although net outflows from major stablecoins USDT and USDC total only $900 million, liquidity in crypto is genuinely tightening. This shows that liquidity is being drained.
So, my plan for what comes next is: first watch, then wait, and finally hang in there.
First, watch BTC’s price to see when it stops falling and when it can form a wick, triggering buy orders.
Second, wait to see whether the market stabilizes, first on the hourly chart and then on the daily chart, and then assess the trading range.
Third, hang in there until the December 9 rate decision meeting. Given how badly the market has fallen, will officials’ dot plot show a softening of their hawkish stance?
The bond market’s pressure on risk assets is still mainly driven by expectations of a rate-hiking cycle. As long as the market gradually lets go of the expectation that rate hikes will return, conditions will gradually ease and the market will rebound.
If we really are heading back into a rate-hiking cycle, then we’ll have to trade as if we’re in a deep bear market. A crypto crash might not matter, but with U.S. stocks crashing like this, can the Republicans and Democrats really just sit back and do nothing? This is people’s money!