https://www.binance.com/download?utm_medium=screenshot
🚨 BTC IN THE CRITICAL ZONE: PANIC OR CAPITULATION? 🚨
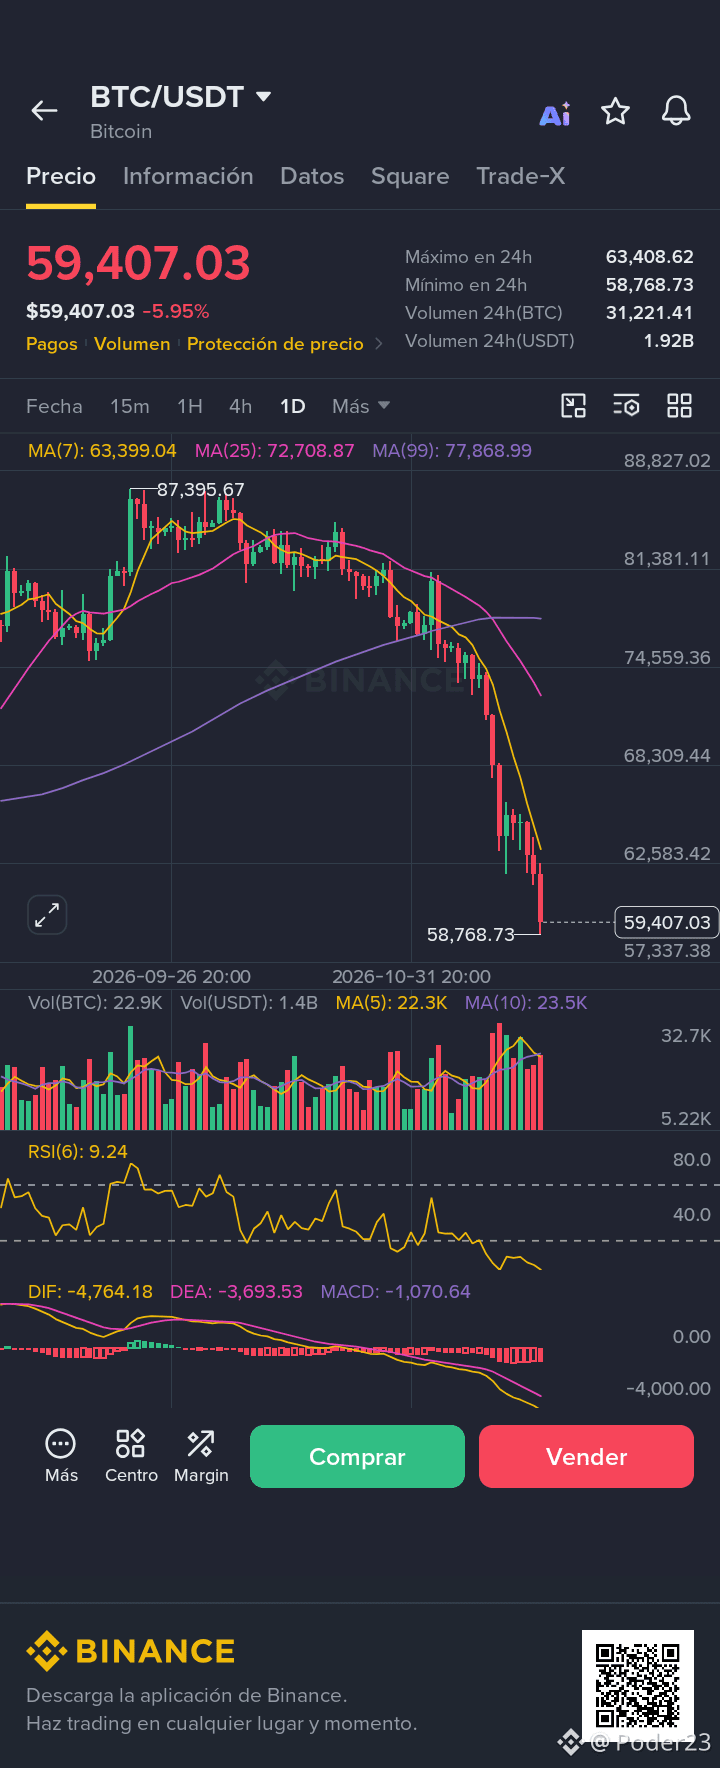
The daily BTC/USDT chart shows a sharp drop, bringing the price to $59,485.78 (-5.87% in 24h), after touching a recent low of $58,768.73 and falling far from the highs of $87,395.67.
What stands out on the 1D chart:
Price vs. Moving Averages: Below MA(7) at $63,410.29, MA(25) at $72,712.02, and MA(99) at $77,869.79.
Volume: High trading activity over 24h, with more than 31.12K BTC and 1.91B USDT.
RSI(6): At 9.32, an extremely oversold level on the daily timeframe.
MACD: Deeply negative (DIF: -4,757.90 | DEA: -3,692.28 | MACD: -1,065.62).
When the daily RSI falls below 10 and the price drops from high levels on this kind of volume, the market is often split between those selling out of fear and those watching for a possible technical rebound or a lower support level (such as the area near $57,337.38 on the chart).
What are you doing at these levels: buying, waiting, or staying out? 👇
Note: This is only a chart analysis and does not constitute financial advice. Do your own research (DYOR).
#BTC #Bitcoin #BinanceSquare #Crypto #Trading
🚨 BTC IN THE CRITICAL ZONE: PANIC OR CAPITULATION? 🚨
The daily BTC/USDT chart shows a sharp drop, bringing the price to $59,485.78 (-5.87% in 24h), after touching a recent low of $58,768.73 and falling far from the highs of $87,395.67.
What stands out on the 1D chart:
Price vs. Moving Averages: Below MA(7) at $63,410.29, MA(25) at $72,712.02, and MA(99) at $77,869.79.
Volume: High trading activity over 24h, with more than 31.12K BTC and 1.91B USDT.
RSI(6): At 9.32, an extremely oversold level on the daily timeframe.
MACD: Deeply negative (DIF: -4,757.90 | DEA: -3,692.28 | MACD: -1,065.62).
When the daily RSI falls below 10 and the price drops from high levels on this kind of volume, the market is often split between those selling out of fear and those watching for a possible technical rebound or a lower support level (such as the area near $57,337.38 on the chart).
What are you doing at these levels: buying, waiting, or staying out? 👇
Note: This is only a chart analysis and does not constitute financial advice. Do your own research (DYOR).
#BTC #Bitcoin #BinanceSquare #Crypto #Trading