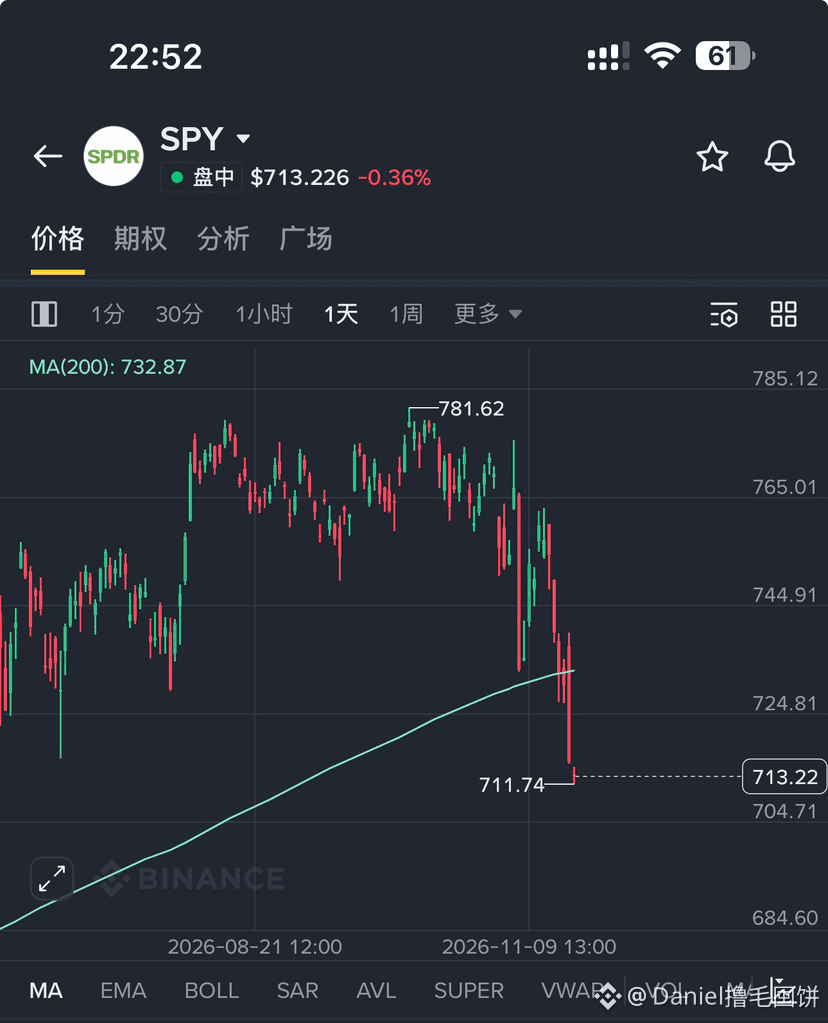
Important alert for U.S. stocks: The S&P 500 has fallen below the MA200. Is the market trend changing?
The S&P 500 closed below its 200-day moving average (MA200) yesterday, a technical signal that warrants close attention.
According to the chart, SPY is currently trading at around $713, while the MA200 is near $732.87. The index is now clearly trading below its long-term moving average.
What does this mean?
1️⃣ Weakening long-term trend: The MA200 is an important indicator of the market’s medium- to long-term trend. A break below it means the market’s bullish structure has been undermined.
2️⃣ Changing market sentiment: If a subsequent rebound fails to reclaim the MA200, it could indicate declining risk appetite and a shift into a more pronounced defensive phase.
3️⃣ Beware of a further pullback: If tech stocks continue to weaken, the Nasdaq 100 could also face greater downward pressure. High-risk assets such as cryptocurrencies should likewise beware of the impact of tightening liquidity.
One point needs to be made clear: A break below the MA200 does not mean the market has officially entered a bear market by the traditional definition (usually a 20% decline from a recent high). Further price action needs to be monitored for confirmation.
Here are three key signals to watch next:
* Can SPY reclaim the MA200?
* Will the Nasdaq 100 also break below its long-term trend support?
* Will the Federal Reserve’s monetary policy and market liquidity tighten further?
For investors, the most important thing right now is not to rush to buy the dip, but to manage position sizes, keep cash on hand, and wait for the trend to provide a clearer signal.
Learn to be aggressive in a bull market, and even more importantly, learn to be defensive when the market weakens.
Do you think this is just a normal technical pullback, or the beginning of a new U.S. stock market bear market?$SPYB
#S&P500
The S&P 500 closed below its 200-day moving average (MA200) yesterday, a technical signal that warrants close attention.
According to the chart, SPY is currently trading at around $713, while the MA200 is near $732.87. The index is now clearly trading below its long-term moving average.
What does this mean?
1️⃣ Weakening long-term trend: The MA200 is an important indicator of the market’s medium- to long-term trend. A break below it means the market’s bullish structure has been undermined.
2️⃣ Changing market sentiment: If a subsequent rebound fails to reclaim the MA200, it could indicate declining risk appetite and a shift into a more pronounced defensive phase.
3️⃣ Beware of a further pullback: If tech stocks continue to weaken, the Nasdaq 100 could also face greater downward pressure. High-risk assets such as cryptocurrencies should likewise beware of the impact of tightening liquidity.
One point needs to be made clear: A break below the MA200 does not mean the market has officially entered a bear market by the traditional definition (usually a 20% decline from a recent high). Further price action needs to be monitored for confirmation.
Here are three key signals to watch next:
* Can SPY reclaim the MA200?
* Will the Nasdaq 100 also break below its long-term trend support?
* Will the Federal Reserve’s monetary policy and market liquidity tighten further?
For investors, the most important thing right now is not to rush to buy the dip, but to manage position sizes, keep cash on hand, and wait for the trend to provide a clearer signal.
Learn to be aggressive in a bull market, and even more importantly, learn to be defensive when the market weakens.
Do you think this is just a normal technical pullback, or the beginning of a new U.S. stock market bear market?$SPYB
#S&P500