
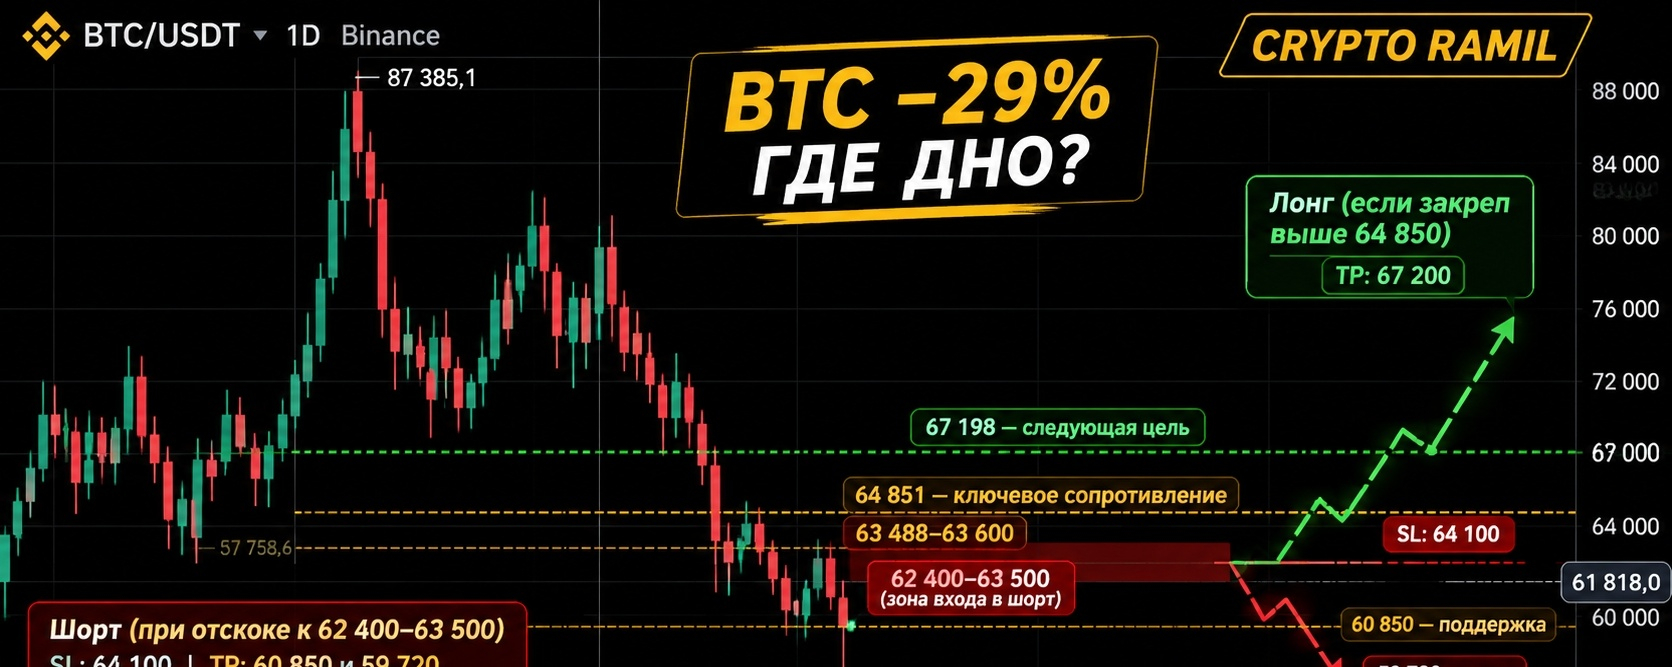

Bitcoin came under serious pressure. The price fell to around $61,200, then partially recovered to $61,700.
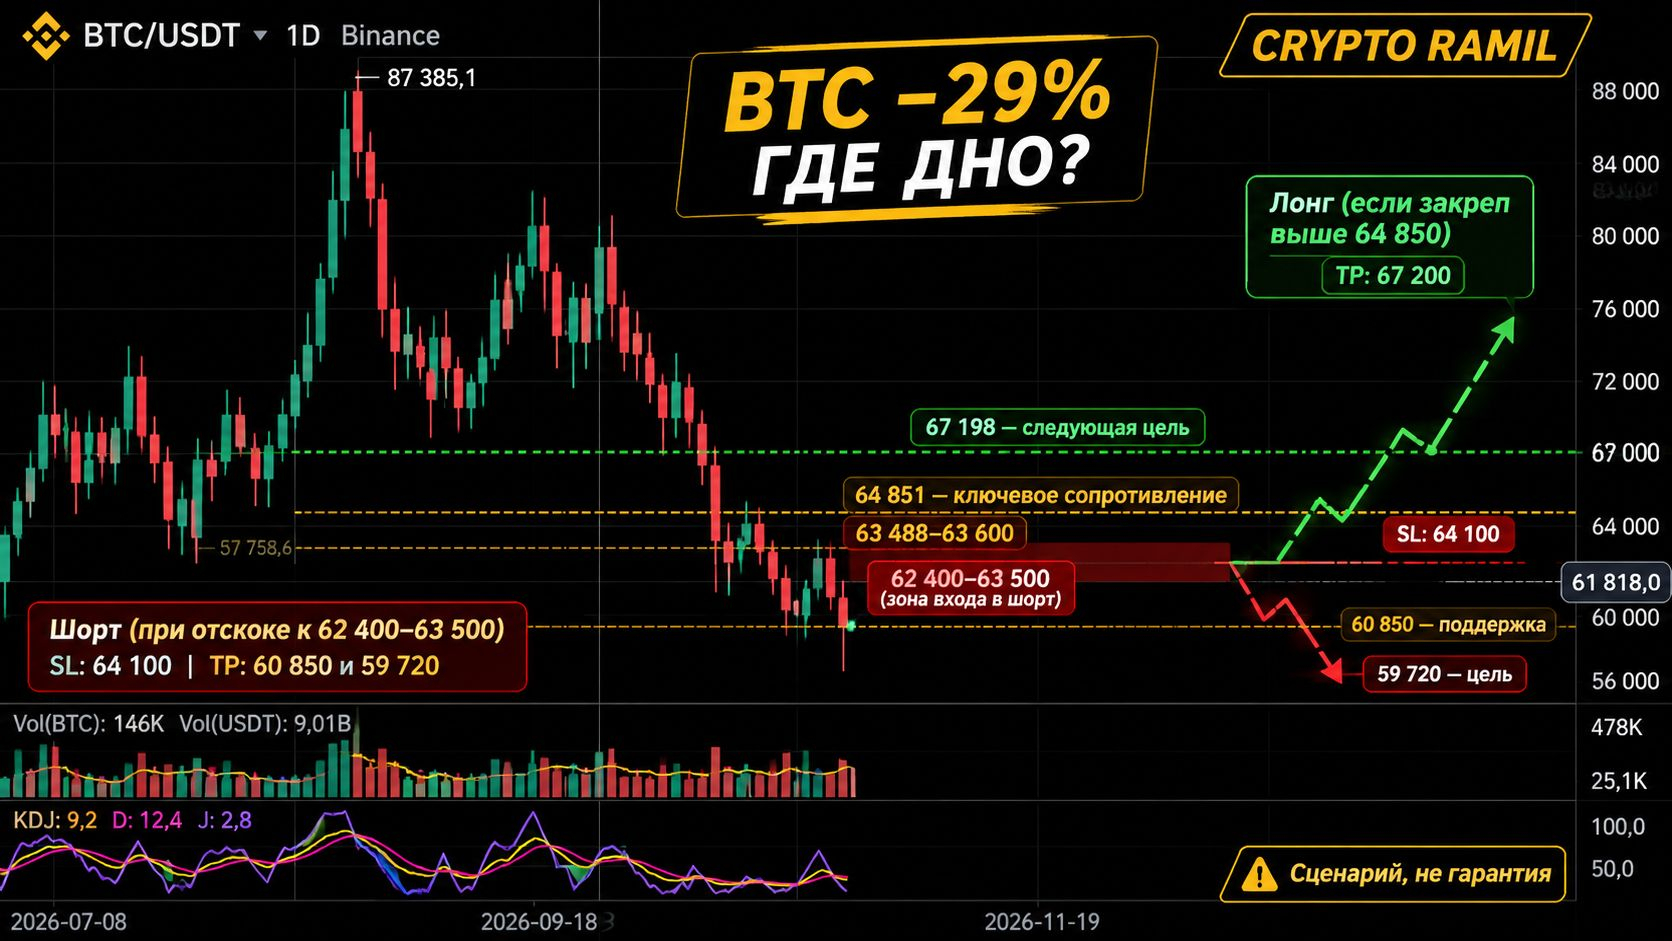
But the most important thing right now isn’t the drop itself. It’s understanding who is selling, why money is flowing out of ETFs, and where the market might find support.
### 📉 1. What happened?
Three factors intensified the pressure on BTC:
🔴 **Record outflows from BlackRock IBIT.** On November 19, investors withdrew $541.1 million from the fund—the largest single-day outflow since its launch.
🔴 **Mass liquidations.** Around $718.6 million worth of positions were liquidated across the crypto market in 24 hours. About 86% were longs.
🔴 **Weakness in the tech sector.** Selling in tech stocks reinforced investors’ reluctance to take risks.
### 📊 2. What does the chart show?
The chart below shows BTC daily closes from November 2 to 19. You can see the price fall from around $76,674 to $61,913.
That’s a drop of about 19.3% over the period shown.
The intraday price on November 20 fell to around $61,200. We’re keeping closing data separate from the current quote.
### 🧭 3. Key BTC levels
**Support:**
- $60,850 — the nearest technical reference level.
- $59,720 — the next zone if the price breaks lower.
- $57,800 — a deeper risk scenario mentioned by analysts.
**Resistance:**
- $62,420 — the first recovery level.
- $63,785–$64,850 — the next important area.
- $67,200 — a more distant target if buyers gain strength.
### 🐻 4. Bearish scenario
If BTC holds below $60,850 at the daily close, the risk of further declines will increase. The next reference level is $59,720.
### 🐂 5. Bullish scenario
If buyers push the price back above $62,420 and then hold it above $63,785–$64,850, that would be the first argument in favor of a recovery.
But a single bounce does not yet mean the trend has reversed.
### 🧠 My takeaway
The market is experiencing more than just a routine correction: ETFs are seeing significant outflows, while leveraged positions are being closed en masse.
At the same time, the RSI on the daily chart is in oversold territory. This allows for a technical bounce, but does not guarantee one.
**I wouldn’t rush to call the bottom. First, we need to see demand return and the price hold above the nearest resistance levels.**
⚠️ This is an analytical scenario, not financial advice. Levels may change along with the market. Do not use leverage unless you understand the risk of liquidation.
### ❓ Audience question
What do you think will happen next?
🐂 **Will BTC hold $60,000 and begin recovering?**
🐻 **Or are we heading toward $57,000–$58,000?**
Share your scenario and reasoning in the comments.
#Bitcoin #BTC #BinanceSquare #CryptoNews #BitcoinAnalysis #Cryptocurrency #CryptoRamil