$SOL Alert! Is this a local bottom before a massive breakout? 🚨
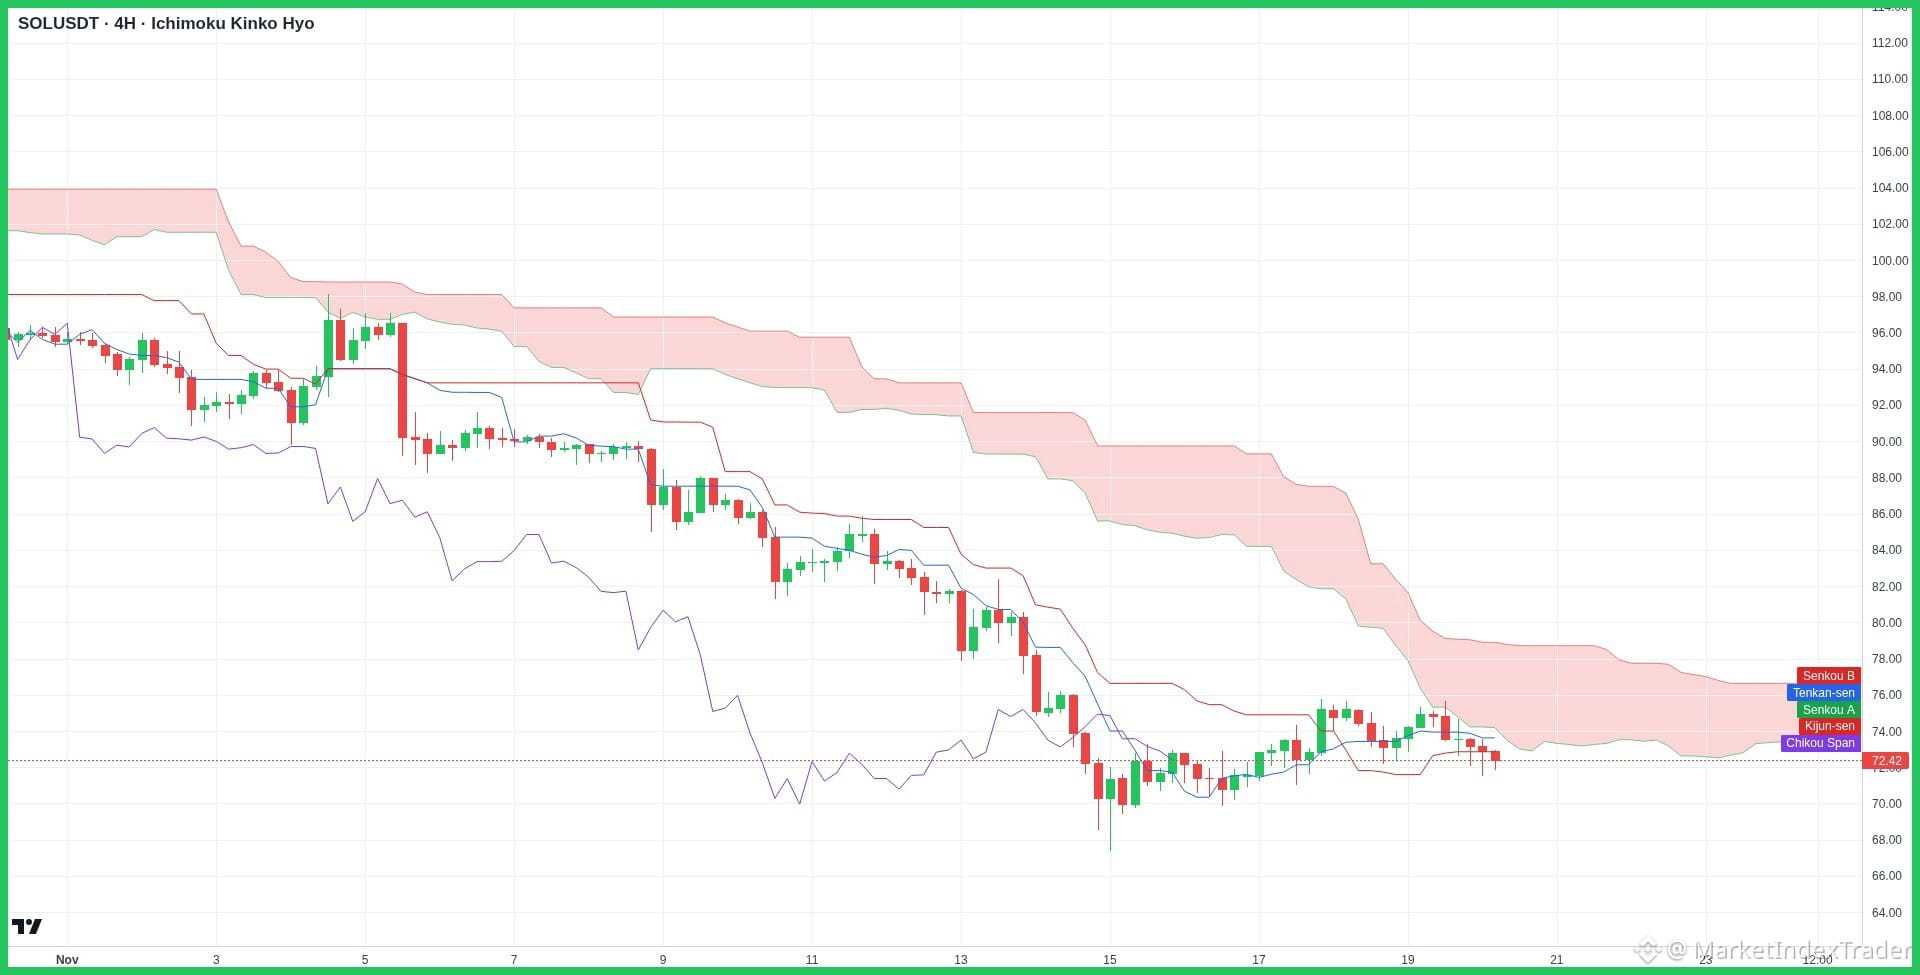
$SOL's 4H chart shows price consolidating around $72.42, testing critical resistance at the bottom of the Ichimoku Cloud.
Alright team, let's break down this juicy $SOL chart and see what's cooking!
Technical Analysis:
Looking at the 4-hour chart, $SOL has found solid temporary support around the $68.00 - $70.00 zone after a prolonged downward trend. Currently trading near $72.42, price action is testing the lower boundary of the Ichimoku Cloud (Senkou Span A/B). A decisive 4H candle close above $76.00 would signal a bullish trend reversal, clearing the path toward $84.00. However, failing to break $76.00 could keep us ranging between $68 and $74.
Fundamental Analysis:
On the fundamental side, the Solana ecosystem continues to demonstrate impressive resilience. Decentralized exchange (DEX) trading volumes on Solana remain top-tier, fueled by high network throughput, extremely low transaction fees, and rapid developer adoption in real-world asset (RWA) tokenization.
Action Plan:
Keep a close eye on the $74-$76 resistance break. Dollar-cost averaging (DCA) near the strong $70 support area offers a great risk-to-reward ratio for spot buyers.
Highly recommend HOLD and Stacking $SOL at Binance
Feel free to comment the altcoin you are holding and we will check it for you!
SOL #Solana #Crypto #TechnicalAnalysis #BinanceSquare #Bitcoin
$SOL's 4H chart shows price consolidating around $72.42, testing critical resistance at the bottom of the Ichimoku Cloud.
Alright team, let's break down this juicy $SOL chart and see what's cooking!
Technical Analysis:
Looking at the 4-hour chart, $SOL has found solid temporary support around the $68.00 - $70.00 zone after a prolonged downward trend. Currently trading near $72.42, price action is testing the lower boundary of the Ichimoku Cloud (Senkou Span A/B). A decisive 4H candle close above $76.00 would signal a bullish trend reversal, clearing the path toward $84.00. However, failing to break $76.00 could keep us ranging between $68 and $74.
Fundamental Analysis:
On the fundamental side, the Solana ecosystem continues to demonstrate impressive resilience. Decentralized exchange (DEX) trading volumes on Solana remain top-tier, fueled by high network throughput, extremely low transaction fees, and rapid developer adoption in real-world asset (RWA) tokenization.
Action Plan:
Keep a close eye on the $74-$76 resistance break. Dollar-cost averaging (DCA) near the strong $70 support area offers a great risk-to-reward ratio for spot buyers.
Highly recommend HOLD and Stacking $SOL at Binance
Feel free to comment the altcoin you are holding and we will check it for you!
SOL #Solana #Crypto #TechnicalAnalysis #BinanceSquare #Bitcoin