On-Chain Hexagram | Today’s Reading: Earth over Water — The Army. Spot Bitcoin ETFs have seen $1.129 billion in outflows over three days; BTC has fallen back below $62,000, and $61,500 is the old floor that held in June. Before, money was lining up to come in; now it’s lining up to go out.
Data: Farside Investors, Lookonchain, SoSoValue, Finnhub; snapshot at 11-20 09:20, with prices and ETF data cross-checked and updated at 20:30.
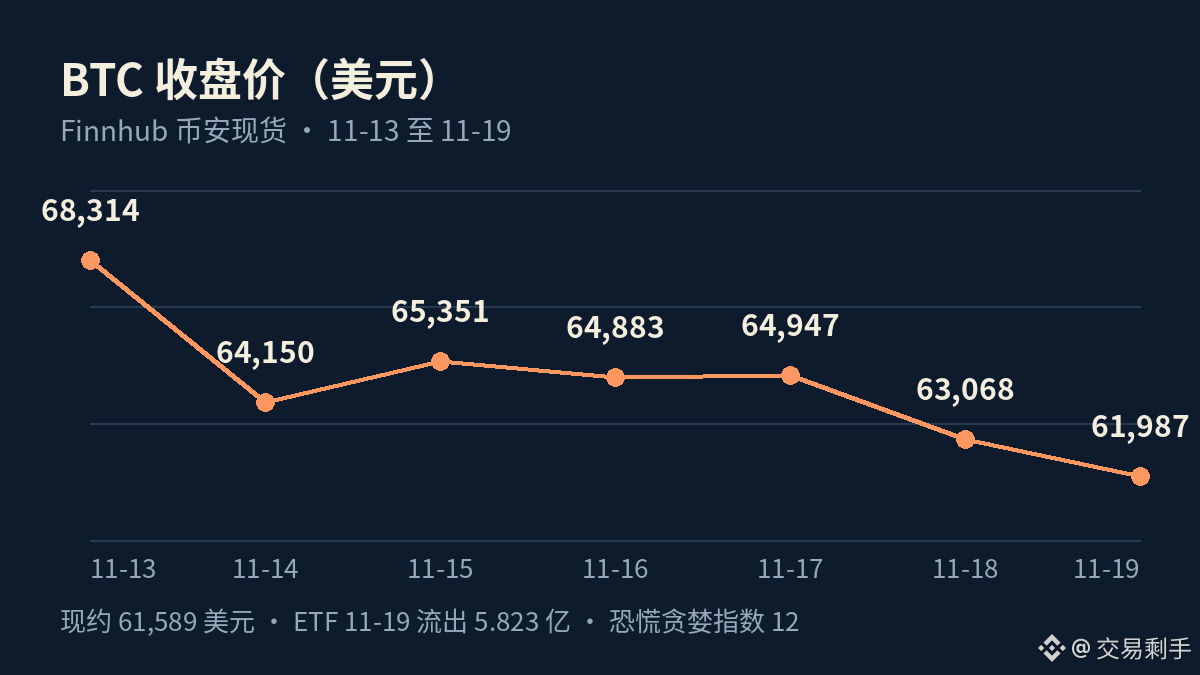
BTC is currently around $61,589 (Finnhub Binance spot at 20:25), with an intraday low of around $61,230. On November 19, it opened around $63,060, climbed to $64,081 before pulling back, hit a low of around $61,428, and closed at $61,987. ETH is currently around $1,739, with an intraday low of around $1,719. The Fear & Greed Index is 12, indicating extreme fear; BTC’s daily RSI is around 19.4, deeply oversold.
ETF inflows resumed just one day after drying up—and the outflows are accelerating. On November 16, there was a net inflow of $7.9 million, snapping a seven-day inflow streak. On November 17, there were $239.9 million in outflows, including $209.5 million from BlackRock’s IBIT alone. On November 18, outflows reached $306.5 million, with another $148.7 million from IBIT. On November 19, outflows hit $582.3 million (Farside’s full figures), including $541.1 million from IBIT alone, setting a record for the fund’s largest single-day outflow. The three-day total was about $1.129 billion. Outflows so far in November total about $3.47 billion, with around $1.306 billion over the past seven days. ETH ETFs also saw $131.2 million in outflows on November 19, of which $124.2 million came from ETHA alone.
Who’s selling? The numbers make it clear: IBIT is driving the outflows. Farside data show that as of November 19, IBIT had seen about $2.94 billion in outflows in November, accounting for around 85% of the month’s total. Selling is concentrated at BlackRock, not among retail investors—institutions are rebalancing, not fleeing for the exits.
BTC is retesting the $61,500 demand zone, a level that held several times in June and July (according to CoinDesk-related analysis). The low was $62,006 on November 15, $61,428 yesterday, and around $61,230 today; BTC briefly fell below $61,500.
Key points on the timeline: November 10, hotter-than-expected CPI (headline +0.4%, core +0.3%); November 12, BTC fell below its 200-day moving average; November 15, low of $62,006; November 16, ETF inflows of $7.9 million snapped the seven-day streak; November 17, Waller called for 50 bp and ETFs saw $239.9 million in outflows; November 18, hawkish FOMC minutes and $306.5 million in ETF outflows; November 19, another $582.3 million in ETF outflows and BTC’s low of $61,428. Next up: the December 8–9 rate decision and November CPI on December 10.
ETFs used to pour money in every day; the narrative was still one of net inflows before November. Now, only two of the first 14 trading days in November saw net inflows (as of November 19)—money is flowing out. $63,000 used to be support; now $61,500 is the last old floor. The bulls need it to hold to have any grounds for their story.
Not found: no verifiable snapshot available for BTC holder count, the share held by the top 10 holders, or 24-hour transfer count.
Do you think $61,500 will hold tonight?
Follow me. I’m keeping an eye on whether $61,500 holds and on daily ETF flows. This is metaphysics-themed entertainment, but the data is real.
The hexagram has been cast; set your own position. —Shengshou
For metaphysical entertainment only; not investment advice.
#玄学炒币 #BTC #ETF #FederalReserve
Data: Farside Investors, Lookonchain, SoSoValue, Finnhub; snapshot at 11-20 09:20, with prices and ETF data cross-checked and updated at 20:30.
BTC is currently around $61,589 (Finnhub Binance spot at 20:25), with an intraday low of around $61,230. On November 19, it opened around $63,060, climbed to $64,081 before pulling back, hit a low of around $61,428, and closed at $61,987. ETH is currently around $1,739, with an intraday low of around $1,719. The Fear & Greed Index is 12, indicating extreme fear; BTC’s daily RSI is around 19.4, deeply oversold.
ETF inflows resumed just one day after drying up—and the outflows are accelerating. On November 16, there was a net inflow of $7.9 million, snapping a seven-day inflow streak. On November 17, there were $239.9 million in outflows, including $209.5 million from BlackRock’s IBIT alone. On November 18, outflows reached $306.5 million, with another $148.7 million from IBIT. On November 19, outflows hit $582.3 million (Farside’s full figures), including $541.1 million from IBIT alone, setting a record for the fund’s largest single-day outflow. The three-day total was about $1.129 billion. Outflows so far in November total about $3.47 billion, with around $1.306 billion over the past seven days. ETH ETFs also saw $131.2 million in outflows on November 19, of which $124.2 million came from ETHA alone.
Who’s selling? The numbers make it clear: IBIT is driving the outflows. Farside data show that as of November 19, IBIT had seen about $2.94 billion in outflows in November, accounting for around 85% of the month’s total. Selling is concentrated at BlackRock, not among retail investors—institutions are rebalancing, not fleeing for the exits.
BTC is retesting the $61,500 demand zone, a level that held several times in June and July (according to CoinDesk-related analysis). The low was $62,006 on November 15, $61,428 yesterday, and around $61,230 today; BTC briefly fell below $61,500.
Key points on the timeline: November 10, hotter-than-expected CPI (headline +0.4%, core +0.3%); November 12, BTC fell below its 200-day moving average; November 15, low of $62,006; November 16, ETF inflows of $7.9 million snapped the seven-day streak; November 17, Waller called for 50 bp and ETFs saw $239.9 million in outflows; November 18, hawkish FOMC minutes and $306.5 million in ETF outflows; November 19, another $582.3 million in ETF outflows and BTC’s low of $61,428. Next up: the December 8–9 rate decision and November CPI on December 10.
ETFs used to pour money in every day; the narrative was still one of net inflows before November. Now, only two of the first 14 trading days in November saw net inflows (as of November 19)—money is flowing out. $63,000 used to be support; now $61,500 is the last old floor. The bulls need it to hold to have any grounds for their story.
Not found: no verifiable snapshot available for BTC holder count, the share held by the top 10 holders, or 24-hour transfer count.
Do you think $61,500 will hold tonight?
Follow me. I’m keeping an eye on whether $61,500 holds and on daily ETF flows. This is metaphysics-themed entertainment, but the data is real.
The hexagram has been cast; set your own position. —Shengshou
For metaphysical entertainment only; not investment advice.
#玄学炒币 #BTC #ETF #FederalReserve