“Institutions are fleeing $BTC ”: that’s the take making the rounds this week. The 13F filings compiled by Galaxy Research (11/19) tell a different story.
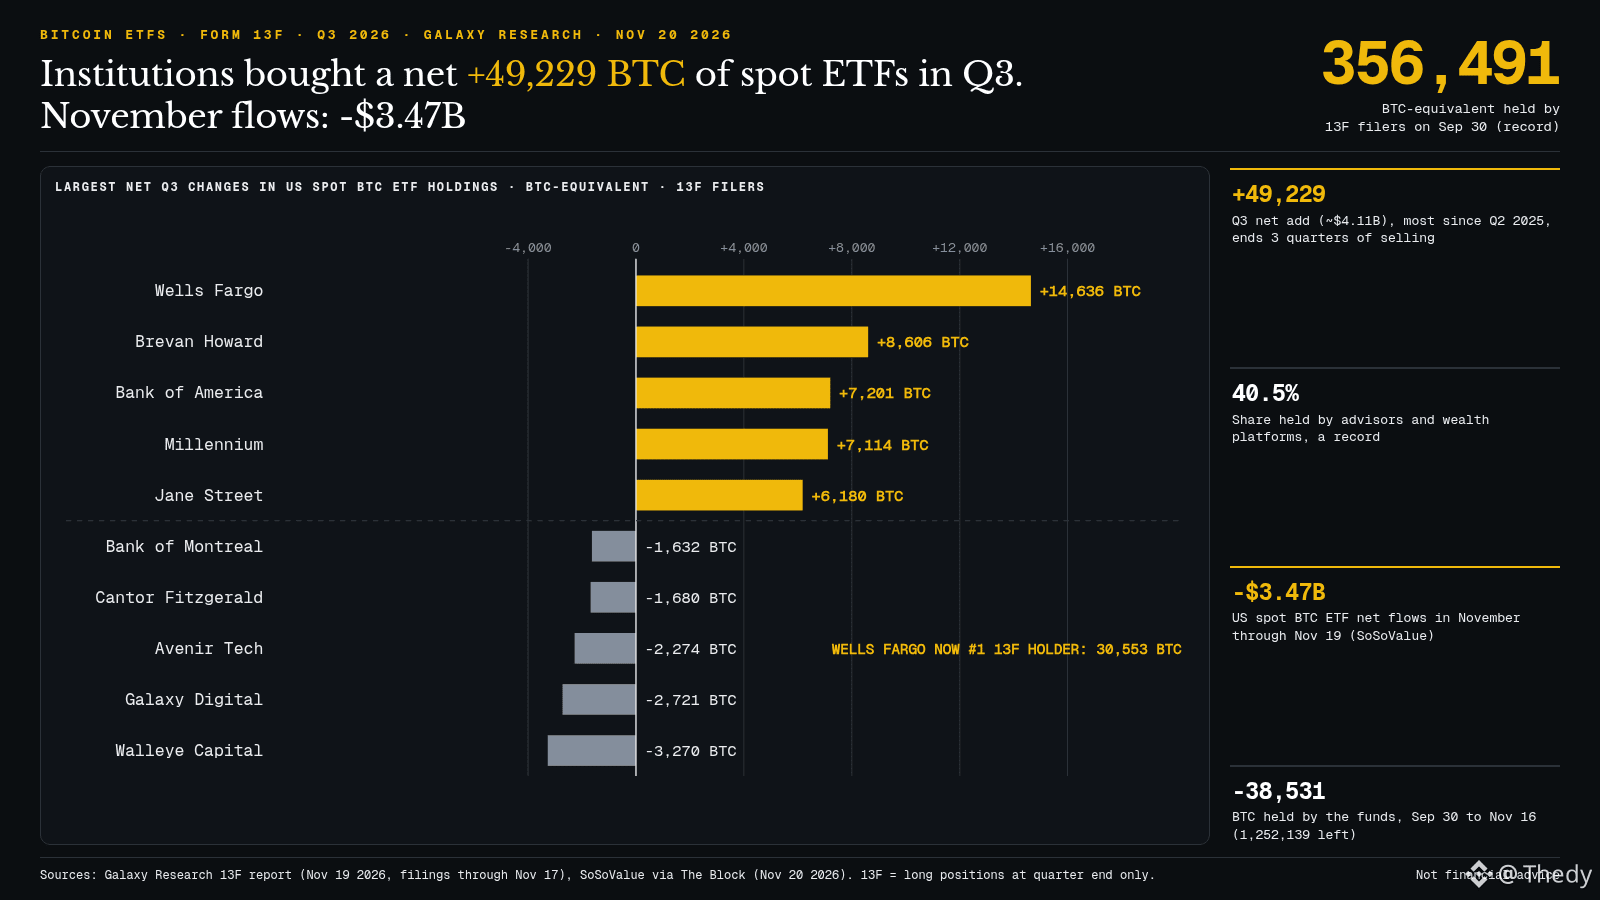
In Q3, managers subject to 13F reporting (SEC) bought a net equivalent of 49,229 BTC through U.S. spot ETFs, worth about $4.11 billion at 9/30 prices. The biggest quarter since Q2 2025, enough to erase the 47,054 BTC sold over the previous three quarters. Total holdings: 356,491 BTC, a record.
The chart shows who moved. Wells Fargo added 14,636 BTC, becoming the largest 13F holder (30,553 BTC), ahead of Jane Street. Brevan Howard added 8,606, Bank of America 7,201. Among sellers, Walleye Capital shed 3,270 and Galaxy Digital 2,721. Advisers and wealth platforms account for 40.5% of 13F holdings, also a record.
The caveat: this is a snapshot as of 9/30. Since then, ETFs have shed 38,531 BTC (1,252,139 as of 11/16, according to Galaxy). And November is decidedly in the red: net outflows of $3.47 billion through 11/19, including $541 million from IBIT on 11/19, its worst daily outflow ever (SoSoValue, The Block). BTC is trading at $61,580 around 12:45 UTC on Binance, down 3.5% over 24 hours.
My take: the wealth channel is buying slowly and steadily (nine consecutive quarters of net purchases), while daily flows mostly reflect faster-moving positions. Both can be true at the same time.
What comes next:
- Base case: flows return toward zero and $61,249 (the July 3 low) holds, which would be consistent with a patient buyer underneath
- Risk: a fourth consecutive session of outflows and a break below $61,249 could mean the Q4 13F (expected in mid-February) shows that even this channel has cut back
Limitation: a 13F only shows long positions at quarter-end, not hedges.
Do you give more weight to the quarterly 13F snapshot or to daily ETF flows when reading the market?
#Bitcoin #ETF
In Q3, managers subject to 13F reporting (SEC) bought a net equivalent of 49,229 BTC through U.S. spot ETFs, worth about $4.11 billion at 9/30 prices. The biggest quarter since Q2 2025, enough to erase the 47,054 BTC sold over the previous three quarters. Total holdings: 356,491 BTC, a record.
The chart shows who moved. Wells Fargo added 14,636 BTC, becoming the largest 13F holder (30,553 BTC), ahead of Jane Street. Brevan Howard added 8,606, Bank of America 7,201. Among sellers, Walleye Capital shed 3,270 and Galaxy Digital 2,721. Advisers and wealth platforms account for 40.5% of 13F holdings, also a record.
The caveat: this is a snapshot as of 9/30. Since then, ETFs have shed 38,531 BTC (1,252,139 as of 11/16, according to Galaxy). And November is decidedly in the red: net outflows of $3.47 billion through 11/19, including $541 million from IBIT on 11/19, its worst daily outflow ever (SoSoValue, The Block). BTC is trading at $61,580 around 12:45 UTC on Binance, down 3.5% over 24 hours.
My take: the wealth channel is buying slowly and steadily (nine consecutive quarters of net purchases), while daily flows mostly reflect faster-moving positions. Both can be true at the same time.
What comes next:
- Base case: flows return toward zero and $61,249 (the July 3 low) holds, which would be consistent with a patient buyer underneath
- Risk: a fourth consecutive session of outflows and a break below $61,249 could mean the Q4 13F (expected in mid-February) shows that even this channel has cut back
Limitation: a 13F only shows long positions at quarter-end, not hedges.
Do you give more weight to the quarterly 13F snapshot or to daily ETF flows when reading the market?
#Bitcoin #ETF