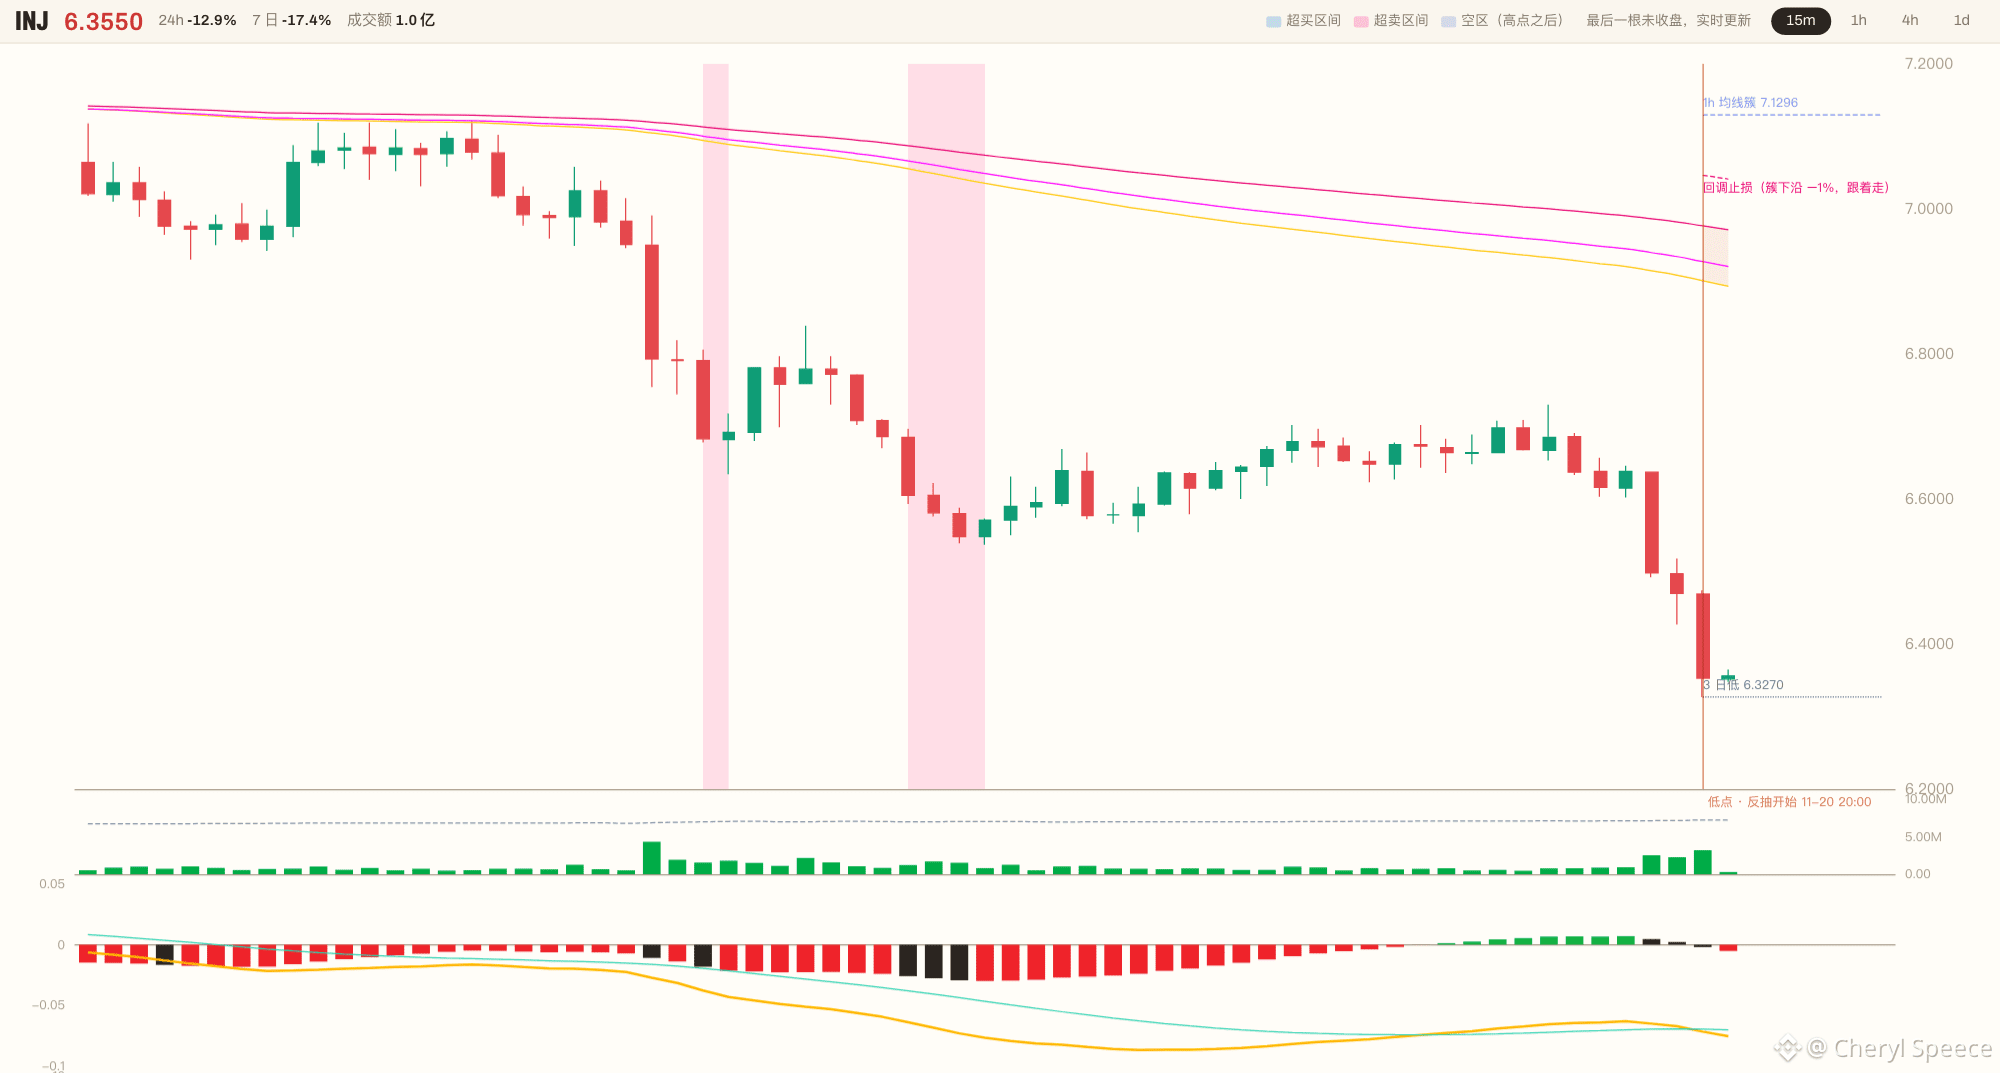
💢 6.3530, let’s lock this closing price on the screen first. $INJ 15m Volume is up 3.8x, and a single candle crashed straight through the previous 12-hour low of 6.4270.
😤 I’ve seen plenty of high-volume breakdowns in a bearish alignment like this—not a bottom, but a prelude to another kick lower.
😑 I went through my checklist: 2 / 4. The breakdown came on volume, and the timing is close enough, but MACD is the deal-breaker: histogram at -0.00199, with DIF still below DEA. Price has been smashed down, but momentum hasn’t bottomed.
💢 And that’s not even mentioning that the close is 8.99% below the top of the moving-average cluster—the lowest point in nearly 96 candles. The 1h trend is bearish, BTC and ETH are both leaning bearish, and I’m not allowing any altcoin longs.
The dividing line is the moment the MACD histogram crosses back above the zero line.
I’m not catching the bottom. I’ll just wait: once the histogram gets back above zero, then we can talk about a rebound. Reaching in now means catching a falling knife.
💬 What do you think: a high-volume break below the previous low, 8.99% away from the cluster, with all the higher timeframes pressing down—is this the bears’ final kick, or has the drop only just begun?
#ETH #BTC $ETH $BTC
😤 I’ve seen plenty of high-volume breakdowns in a bearish alignment like this—not a bottom, but a prelude to another kick lower.
😑 I went through my checklist: 2 / 4. The breakdown came on volume, and the timing is close enough, but MACD is the deal-breaker: histogram at -0.00199, with DIF still below DEA. Price has been smashed down, but momentum hasn’t bottomed.
💢 And that’s not even mentioning that the close is 8.99% below the top of the moving-average cluster—the lowest point in nearly 96 candles. The 1h trend is bearish, BTC and ETH are both leaning bearish, and I’m not allowing any altcoin longs.
The dividing line is the moment the MACD histogram crosses back above the zero line.
I’m not catching the bottom. I’ll just wait: once the histogram gets back above zero, then we can talk about a rebound. Reaching in now means catching a falling knife.
💬 What do you think: a high-volume break below the previous low, 8.99% away from the cluster, with all the higher timeframes pressing down—is this the bears’ final kick, or has the drop only just begun?
#ETH #BTC $ETH $BTC