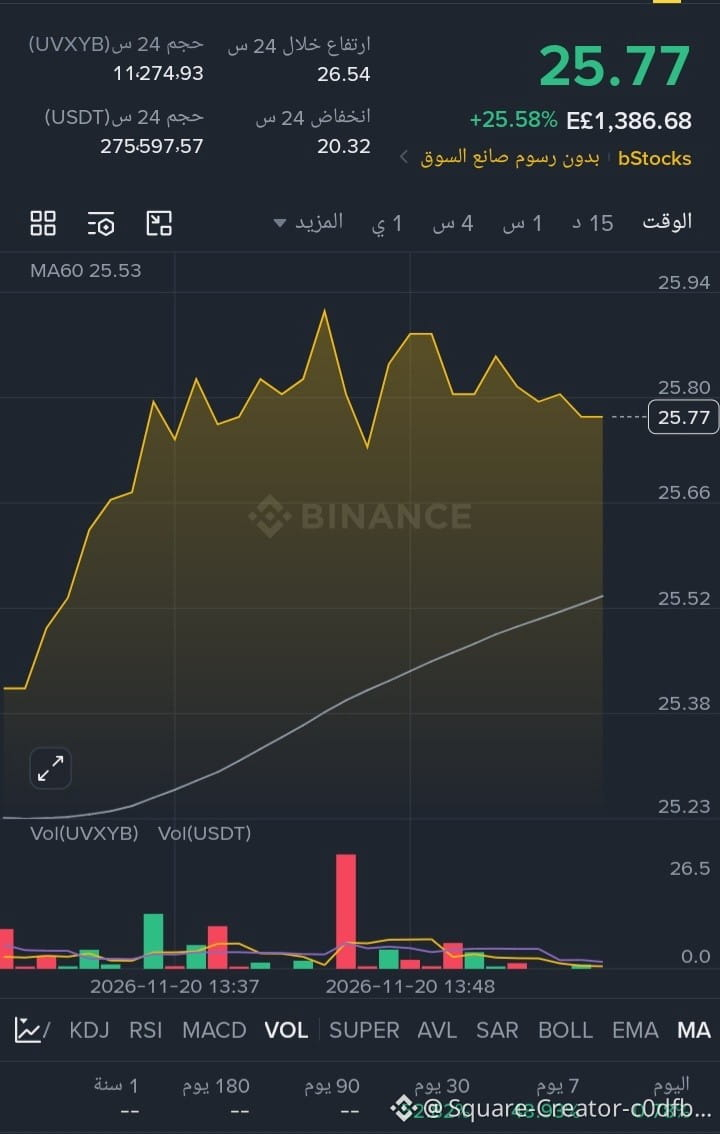
A notable upward move and clear volatility on the chart—will the price continue rising or start pulling back toward the moving averages? The chart data for UVXYB shows an increase of +25.58%, with the price trading at 25.77, and 24-hour trading volume reaching 11,274.93 of UVXYB and 275,597.57 of USDT.
Technical reading and key levels
Trend and moving averages: The current price is moving at 25.77 above the MA60 moving average at 25.53, reflecting dynamic support below the current price as long as it remains above it.
24-hour trading range: The 24-hour high was 26.54 and the low was 20.32, while nearby price-axis levels on the chart include 25.80 and 25.94.
Buy and sell zones and targets
Buy zone (support): Buy areas stand out on pullbacks near 25.52 – 25.38 close to the MA60 line at 25.53, then 25.23 as deeper support on the chart.
Sell zone (resistance and profit-taking): Profit-taking areas begin near 25.80 – 25.94 on the chart, then the 24-hour recorded high at 26.54.
Targets:
First target: 25.80.
Second target: 25.94.
Third target: 26.54.
Note: This analysis is for educational and informational purposes only
What do you think about UVXYB's movement now: do you see a breakout toward 25.94 or a retest of 25.52?
#UVXYB #تحليل_فني #تداول_العملات_الرقمية #Binance #$UVXYB
Technical reading and key levels
Trend and moving averages: The current price is moving at 25.77 above the MA60 moving average at 25.53, reflecting dynamic support below the current price as long as it remains above it.
24-hour trading range: The 24-hour high was 26.54 and the low was 20.32, while nearby price-axis levels on the chart include 25.80 and 25.94.
Buy and sell zones and targets
Buy zone (support): Buy areas stand out on pullbacks near 25.52 – 25.38 close to the MA60 line at 25.53, then 25.23 as deeper support on the chart.
Sell zone (resistance and profit-taking): Profit-taking areas begin near 25.80 – 25.94 on the chart, then the 24-hour recorded high at 26.54.
Targets:
First target: 25.80.
Second target: 25.94.
Third target: 26.54.
Note: This analysis is for educational and informational purposes only
What do you think about UVXYB's movement now: do you see a breakout toward 25.94 or a retest of 25.52?
#UVXYB #تحليل_فني #تداول_العملات_الرقمية #Binance #$UVXYB