$BTC
When will the correction end, and what conditions need to be met for prices to find a bottom?
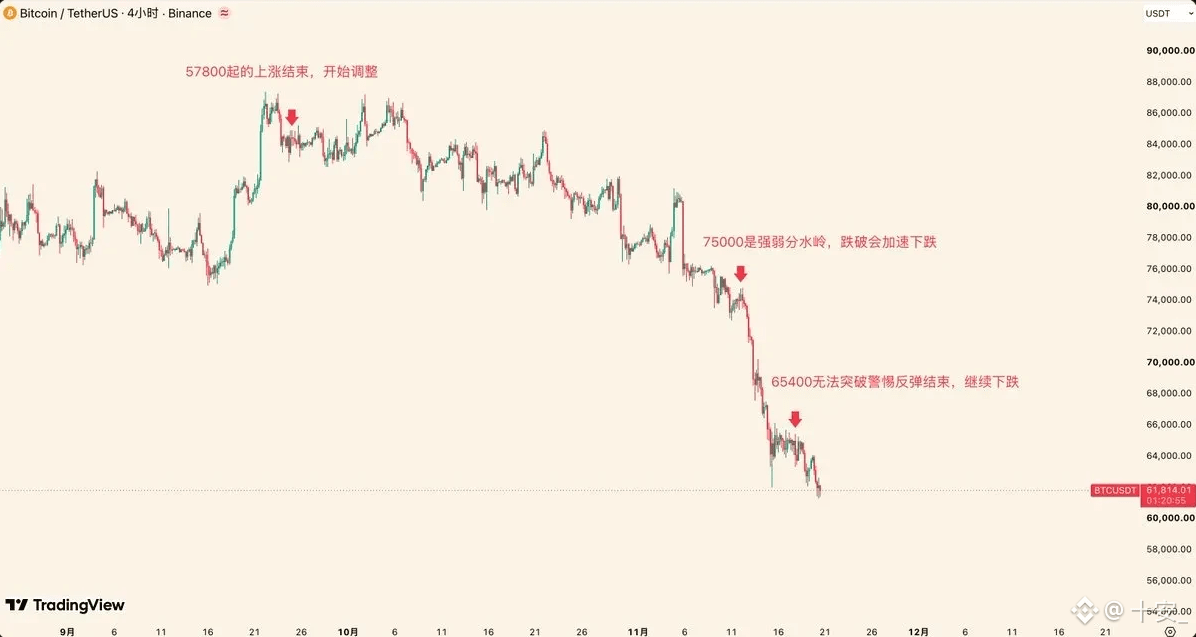
As early as September 24, I judged that the rally which began at 57,800 had ended and that the correction would continue through November. That timing proved accurate, but the market turned out to be more complex than expected.
Since November 5, BTC has repeatedly battled around 75,000. It failed to stage a V-shaped reversal at a key level, and support gave way. On the 7th, I noted that a break below 75,000 would trigger an accelerated decline. The market subsequently fell to 62,000. Last week, it rebounded from 62,000 to 66,000 before pulling back again. The 65,400 level was the dividing line between strength and weakness for this rebound; after several failed attempts to hold above it, it became clear that the move from 62,000 to 66,000 was merely a rebound amid the decline, and that the market had not yet bottomed.
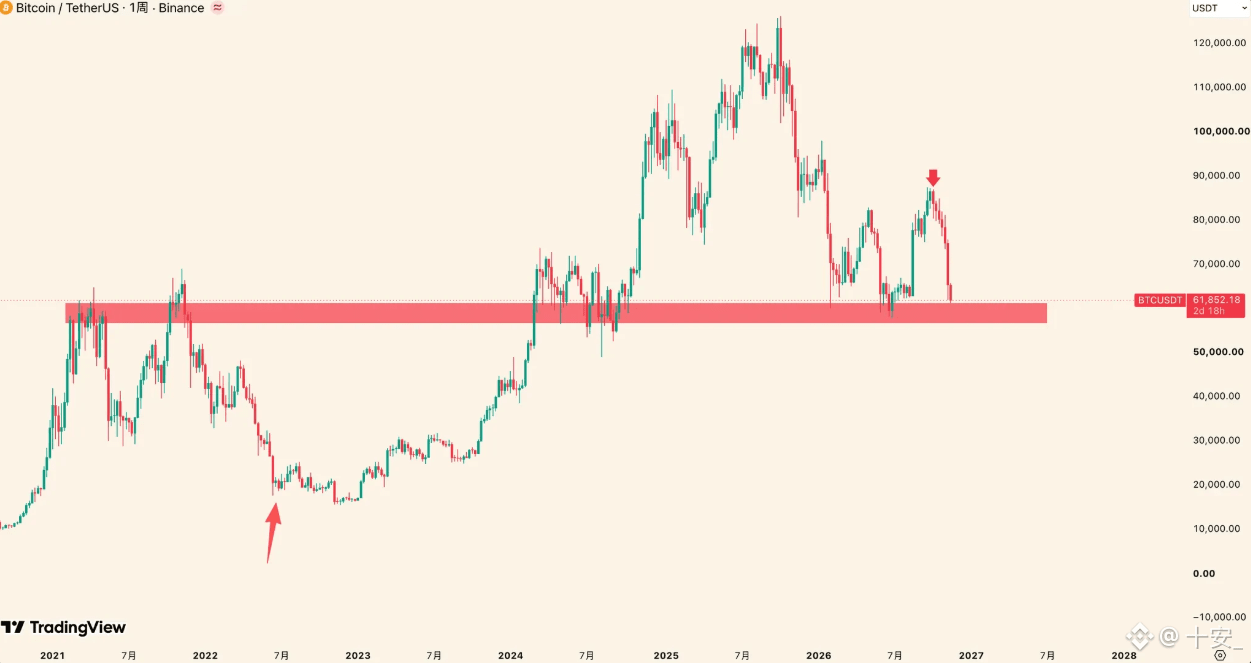
The current weekly-chart correction, which began at 87,395, has an unusually rare structure. To confirm that prices have bottomed, we need to see a clear weekly-chart stabilization signal. BTC has now entered a key observation zone that includes the previous low of 57,800. This week's or next week's weekly close is the key window to watch.
There are two healthy patterns: a direct V-shaped reversal, or an accelerated drop followed by a candle with a long lower wick. Either could signal a temporary bottom. Conversely, if prices continue to drift lower or move sideways near key support while forming a base, the market would look weak and the risks would be greater.
Shorter time frames are prone to all kinds of false rallies and misleading price action, so there is no need to be distracted by short-term fluctuations. The most reliable way to judge whether this decline is over is to look for a reversal on the weekly chart or a bottoming candle with a long lower wick.
When will the correction end, and what conditions need to be met for prices to find a bottom?
As early as September 24, I judged that the rally which began at 57,800 had ended and that the correction would continue through November. That timing proved accurate, but the market turned out to be more complex than expected.
Since November 5, BTC has repeatedly battled around 75,000. It failed to stage a V-shaped reversal at a key level, and support gave way. On the 7th, I noted that a break below 75,000 would trigger an accelerated decline. The market subsequently fell to 62,000. Last week, it rebounded from 62,000 to 66,000 before pulling back again. The 65,400 level was the dividing line between strength and weakness for this rebound; after several failed attempts to hold above it, it became clear that the move from 62,000 to 66,000 was merely a rebound amid the decline, and that the market had not yet bottomed.
The current weekly-chart correction, which began at 87,395, has an unusually rare structure. To confirm that prices have bottomed, we need to see a clear weekly-chart stabilization signal. BTC has now entered a key observation zone that includes the previous low of 57,800. This week's or next week's weekly close is the key window to watch.
There are two healthy patterns: a direct V-shaped reversal, or an accelerated drop followed by a candle with a long lower wick. Either could signal a temporary bottom. Conversely, if prices continue to drift lower or move sideways near key support while forming a base, the market would look weak and the risks would be greater.
Shorter time frames are prone to all kinds of false rallies and misleading price action, so there is no need to be distracted by short-term fluctuations. The most reliable way to judge whether this decline is over is to look for a reversal on the weekly chart or a bottoming candle with a long lower wick.