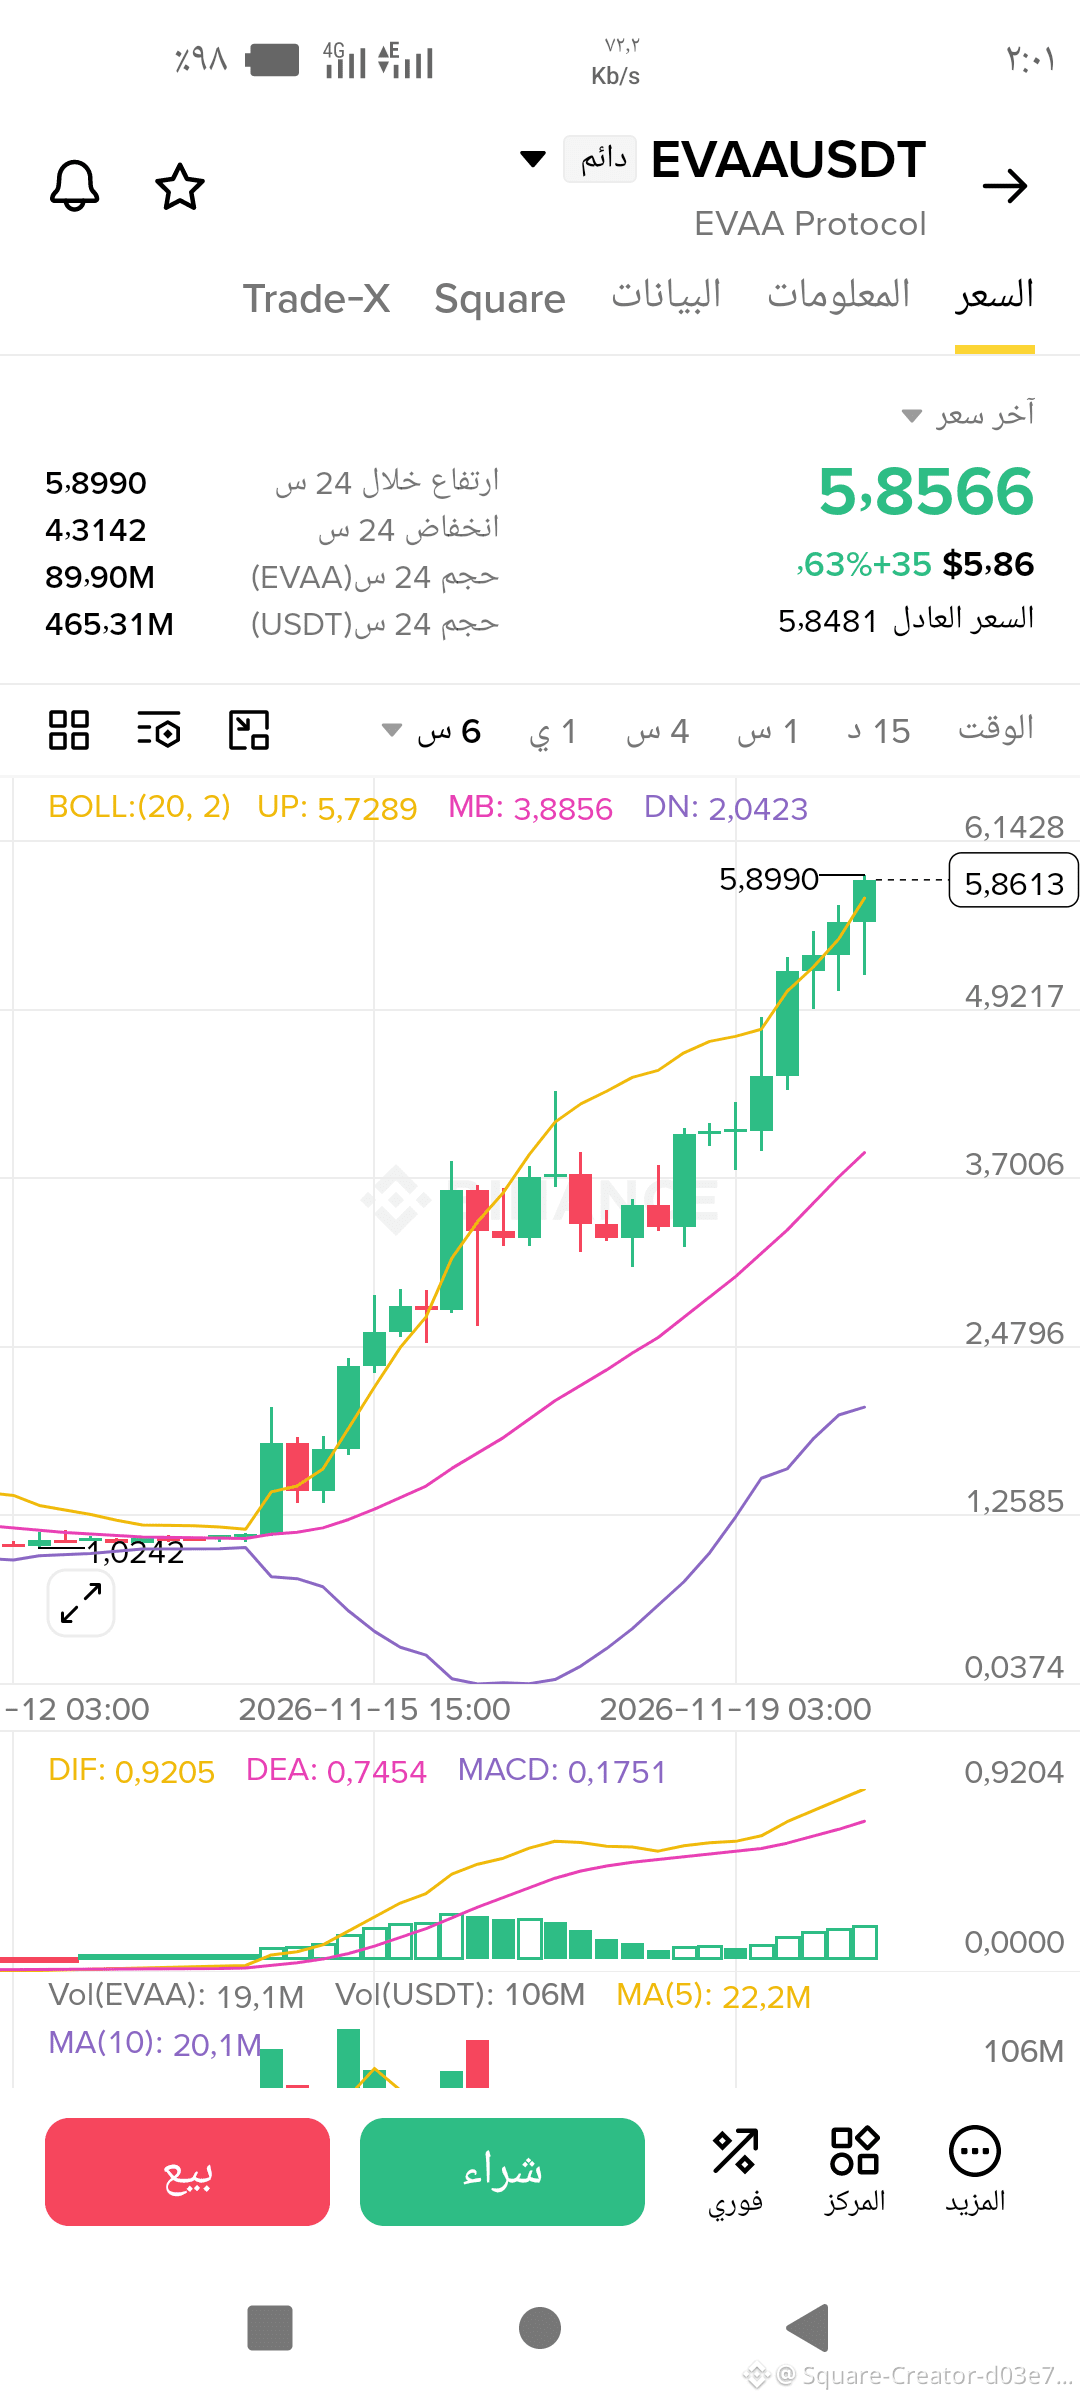
⚡ Price momentum breakdown for $EVAA : when technical physics meets liquidity!
The price is now trading near $5.85 after a clear breakout above the upper Bollinger Band (BOLL UP at $5.7289) and a positive MACD confirmation with a clear bullish crossover (MACD: 0.1751), with attention strongly shifting toward the psychological and technical $6.00 barrier!
📊 Why is this scene different from random noise?
Trend confirmation: two previous scenarios reached their targets precisely; and whoever missed the pivot zone near $4.39 saw how momentum shifted from mere accumulation into a real surge backed by high liquidity volume (exceeding 465M USDT within 24 hours).
Breakout dynamics: breaking the upper Bollinger range with the gap widening from the middle average ($3.8856) reflects strong price expansion, but smart markets at the same time watch for the possibility of volatility or a retest near nearby support levels before any continuation.
🧠 The real question for traders:
Are we facing a continuation of the bullish momentum wave to test $6 and beyond, or is the market preparing to catch its breath after this accelerated rise?
Write your technical outlook and your target number in the comments — let’s see the market through analysis, not emotion! 👇🔥
(Disclaimer: this content is an analytical and informational reading of the chart and displayed data, and is not an investment or financial recommendation.)
$EVAA
The price is now trading near $5.85 after a clear breakout above the upper Bollinger Band (BOLL UP at $5.7289) and a positive MACD confirmation with a clear bullish crossover (MACD: 0.1751), with attention strongly shifting toward the psychological and technical $6.00 barrier!
📊 Why is this scene different from random noise?
Trend confirmation: two previous scenarios reached their targets precisely; and whoever missed the pivot zone near $4.39 saw how momentum shifted from mere accumulation into a real surge backed by high liquidity volume (exceeding 465M USDT within 24 hours).
Breakout dynamics: breaking the upper Bollinger range with the gap widening from the middle average ($3.8856) reflects strong price expansion, but smart markets at the same time watch for the possibility of volatility or a retest near nearby support levels before any continuation.
🧠 The real question for traders:
Are we facing a continuation of the bullish momentum wave to test $6 and beyond, or is the market preparing to catch its breath after this accelerated rise?
Write your technical outlook and your target number in the comments — let’s see the market through analysis, not emotion! 👇🔥
(Disclaimer: this content is an analytical and informational reading of the chart and displayed data, and is not an investment or financial recommendation.)
$EVAA