



BTC rebounded from around 60,000 in August to 87,000, then fell back to 60,000, catching everyone off guard. My initial view was that a daily-chart correction would come near 87,000. I didn’t expect a weekly-chart correction to hit directly. Now we’re back where we started. I don’t think there’s any point in analyzing, with hindsight, why the price fell so much. We’d be better off looking ahead. Let’s think together: where is BTC most likely to bottom in this bear market?
As we look at how BTC may bottom in this bear market, let’s also look at how it topped in the previous bull market. The same trading tactics might offer us some insight. In 2025, BTC first rose to 107,000, then fell all the way to 90,000. After consolidating for a while, it climbed again to around 110,000, then dropped all the way to around 75,000. Just as everyone thought the top was in and started piling into short positions, BTC launched into a third rally, surging straight to 126,000. It distributed at these high levels for three months before officially topping out. That’s how Bitcoin’s previous bull market was topped.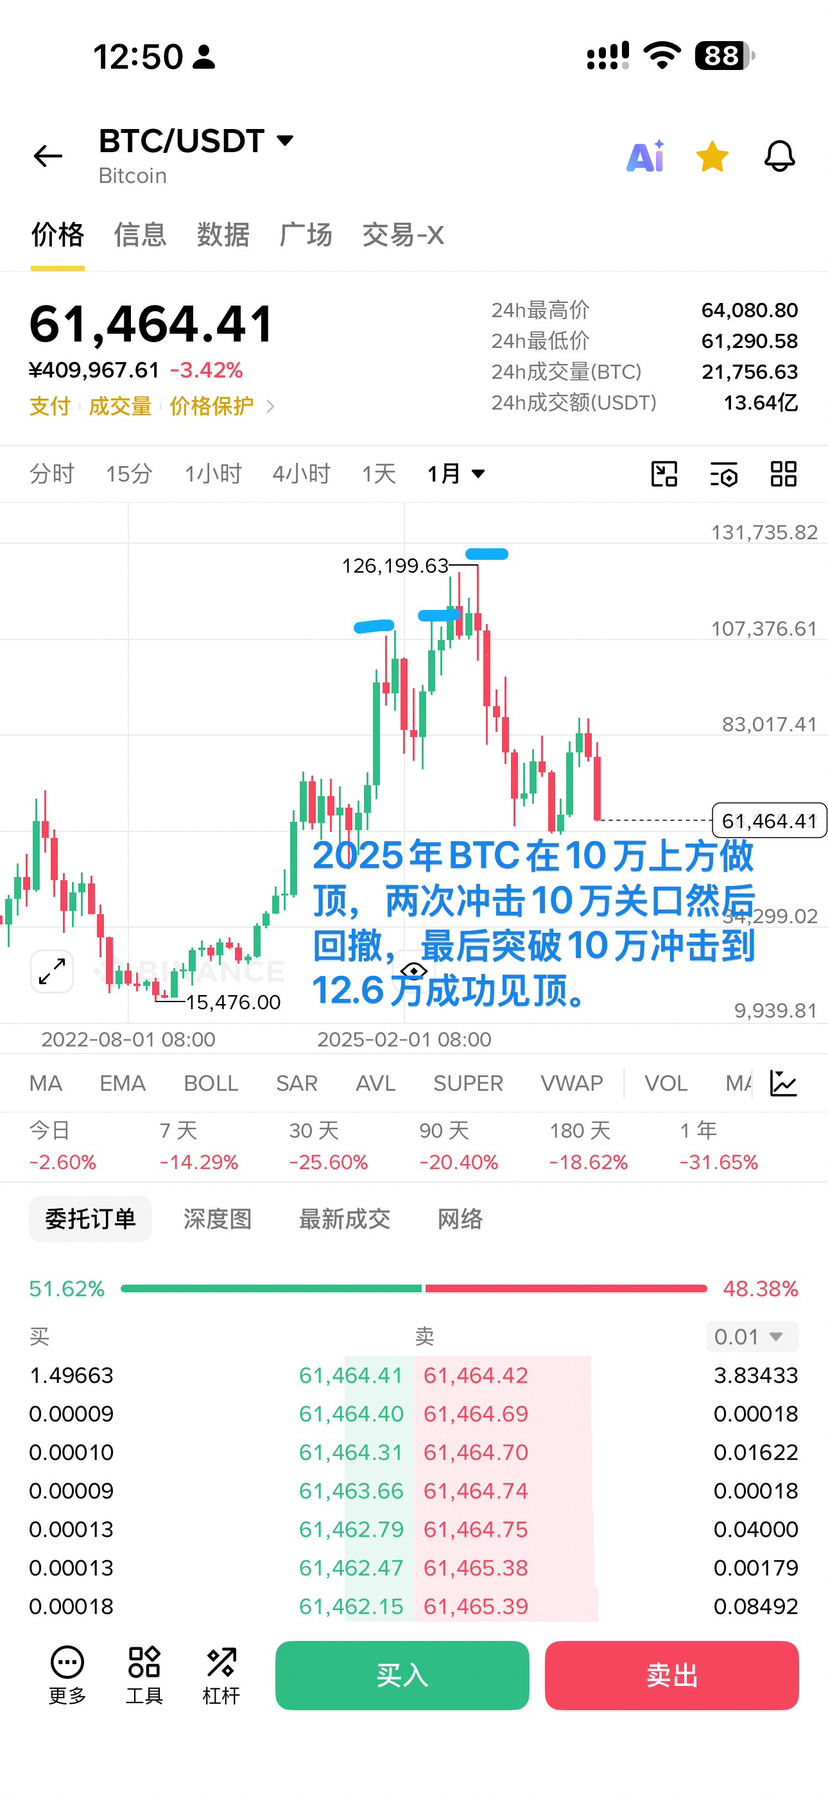
After analyzing the trading tactics used to form a top in the BTC bull market, let’s look at the tactics being used to form a bottom in the current BTC bear market. BTC first plunged to around 61,000, then rebounded to around 81,000, before falling again to 57,000 and rebounding once more to 87,000. Most recently, it plunged back to around 60,000. This trading pattern is a little like how BTC repeatedly challenged the 100,000 level while forming a top in the previous bull market. We can treat the current key level of 60,000 as equivalent to the 100,000 level in the previous bull market. Back then, the 100,000 mark looked very shaky, and many people thought it wouldn’t hold. But not only did it hold, it was eventually broken, and the price rose to 126,000. The current 60,000 level has also been tested many times. It looks very solid on the surface, but I still think there’s a good chance it won’t hold. In other words, after two tests that both led to sharp rebounds, if the price falls back to this level again, it will most likely break below it decisively and head toward 50,000. Looking at how the 100,000 level held in the previous bull market before the price rose to 126,000, a successful break below 60,000 would likely mean a retest of around 50,000–55,000 at most. So the true bottom shouldn’t be very far away.
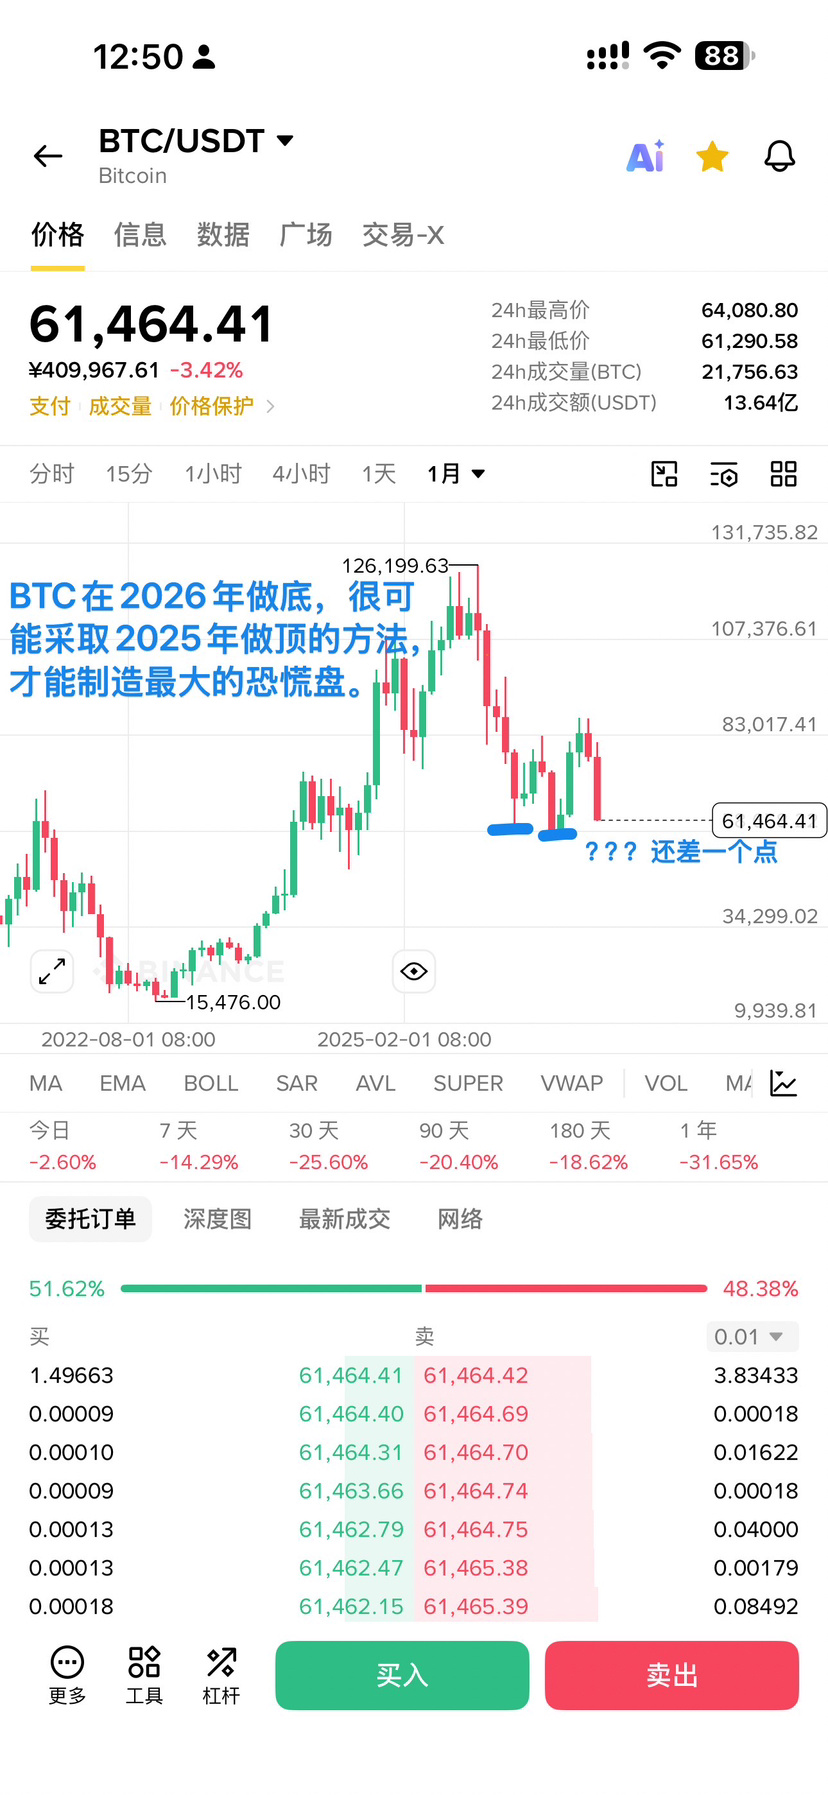
Now let’s look at market sentiment. In the previous bull market, most people were expecting 150,000–200,000, but market sentiment wasn’t firmly established. Once Bitcoin held above 100,000 and rose to 126,000, market sentiment became strongly bullish, with most people expecting 150,000–200,000. This gave major players plenty of liquidity to sell into. In the current bear market, many people are calling for a bottom at 30,000–40,000, but market sentiment isn’t firmly established. If Bitcoin decisively breaks below the previous low of 57,000, market sentiment will become very firmly set on 30,000–40,000. The market will see a huge wave of panic selling, and many retail investors won’t dare to buy the dip. That will also give major players room to accumulate cheap coins.
Considering both the trading tactics and market sentiment, when it comes to spot trading, I personally will continue buying in batches around 60,000. If the price later does reach the bottom I’m predicting, at 50,000–55,000, I can keep adding in batches. As for the 30,000–40,000 level that many people are expecting, I personally don’t think the price will reach it. If it does and I end up stuck holding at a loss, there’s nothing I can do about it. As adults, we have to take responsibility for our choices and accept the outcome of our bets. There’s nothing new under the sun; what we’re experiencing now has happened many times before. Don’t be pessimistic. What’s meant to come will come.