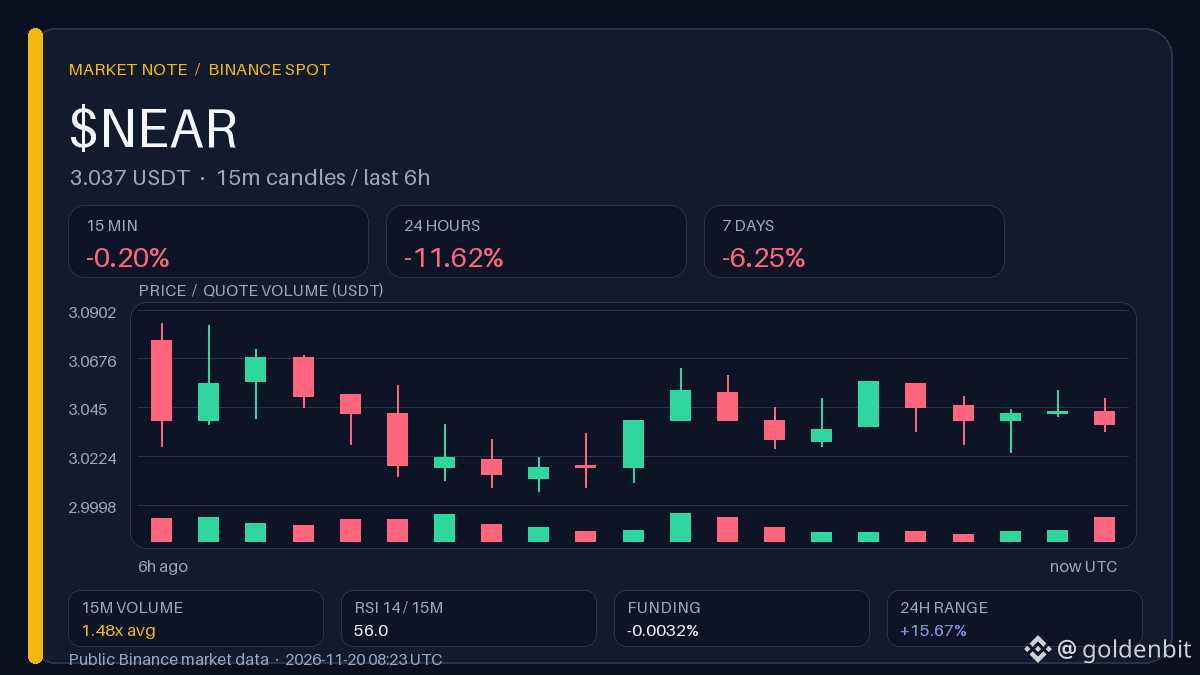
$NEAR : negative funding at −11.62% over 24 hours—not fuel, but a trace
Negative funding here is more likely to reflect a positioning imbalance after the drop than to predict a reversal. The 24-hour figure is −11.62%, while the weekly figure is −6.25%: the short-term impulse is weaker than the longer-term trend, and the price is holding in the upper half of the five-hour range—a stabilization hypothesis, not a fact.
Observation range · 5 h
Above 3.0840: Holding above the upper boundary of the local range would weaken the interpretation of the drop as a trend continuation.
Below 3.0060: A return to the lower boundary of the range would confirm that the bounce was merely a pause within the daily decline.
Historical levels; a single wick does not confirm a scenario.
🗞 News: Cointelegraph.
If funding remains negative while the market moves sideways, will the open interest structure change?
Binance data, snapshot at 08:23 UTC. The author may receive rewards through Binance Square Write to Earn.
Negative funding here is more likely to reflect a positioning imbalance after the drop than to predict a reversal. The 24-hour figure is −11.62%, while the weekly figure is −6.25%: the short-term impulse is weaker than the longer-term trend, and the price is holding in the upper half of the five-hour range—a stabilization hypothesis, not a fact.
Observation range · 5 h
Above 3.0840: Holding above the upper boundary of the local range would weaken the interpretation of the drop as a trend continuation.
Below 3.0060: A return to the lower boundary of the range would confirm that the bounce was merely a pause within the daily decline.
Historical levels; a single wick does not confirm a scenario.
🗞 News: Cointelegraph.
If funding remains negative while the market moves sideways, will the open interest structure change?
Binance data, snapshot at 08:23 UTC. The author may receive rewards through Binance Square Write to Earn.