Gold at $3,560—is this the bottom?
The Fed is all but certain to raise rates in December, the dollar index is at a 19-month high, and the 10-year Treasury yield is 5.1%—gold has plunged from $5,590 to $3,560, with its worst weekly performance in eight months. This isn’t a pullback; it’s a slaughterhouse.
First, the surface picture: it’s down by a third, so it looks “cheap.”
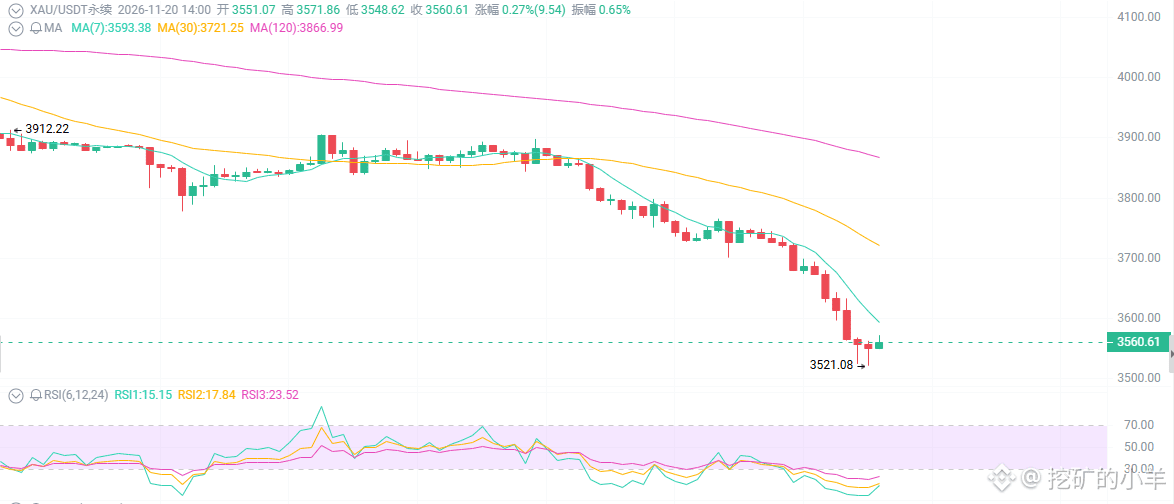
Gold has fallen about 36% from its January high of $5,590 to $3,560. It dropped 8%–9% for the week, its worst showing in nearly eight months, and hit its lowest level since September 2025. The 24-hour low was $3,514–$3,520, and the high was $3,740–$3,750.
Are you getting that itch? “It’s fallen so much already—it has to bounce, right?”
First: The Fed isn’t just hawkish; it’s dead set on killing gold.
The October FOMC minutes showed that almost all officials thought further rate hikes were needed. Several Fed officials publicly stressed that inflation remains high and even mentioned the possibility of a half-point rate hike. CME FedWatch puts the odds of a 25 bp hike at the December 9 meeting at around 93%–97%.
Gold pays no interest, while the interest you can earn by keeping money in the bank or buying Treasuries keeps rising.
The dollar index is near a 19-month high, and the 10-year Treasury yield is holding around 5.1%. A strong dollar plus high real interest rates is gold’s biggest enemy.
Second: Central-bank gold buying is a long-term story; it can’t save you in the short term.
Central banks bought around 321 tonnes of gold in Q3, up 42% year over year. That’s a source of medium- to long-term support. But ETF funds have continued to flow out. Geopolitical and fiscal risks are still there, too. But in the short term, pricing power lies with the Fed, the dollar, and yields.
Don’t use “central banks are buying” to reassure yourself.
Central banks are buying based on a five- or ten-year thesis; you’re carrying leverage over five or ten days.
A long-term story can’t save a short-term position.
Third: The technicals are telling you that a bounce is your chance to get out alive.
The daily, 4H, and 1H charts all show a clear downtrend structure: lower highs and lower lows. Price is trading below the descending channel, with several large bearish candles breaking below $3,800 and $3,700 before the decline accelerated.
The 1H RSI is often below 20, signaling extreme oversold conditions.
The MACD histogram is becoming more negative.
The SMA20 is acting as resistance above $3,640–$3,650.
ATR shows hourly volatility is still $20–$30.
Could oversold conditions trigger a bounce? Yes.
But until the macro picture turns, a bounce is more likely to be a rally to sell into than a reversal.
Support: $3,515–$3,520 (recent low) → $3,480–$3,500 → $3,420
Resistance: $3,590–$3,600 → $3,640–$3,650 → $3,680–$3,700 → $3,750–$3,800
A decisive daily close below $3,515 would open up more downside.
The Fed is all but certain to raise rates in December, the dollar index is at a 19-month high, and the 10-year Treasury yield is 5.1%—gold has plunged from $5,590 to $3,560, with its worst weekly performance in eight months. This isn’t a pullback; it’s a slaughterhouse.
First, the surface picture: it’s down by a third, so it looks “cheap.”
Gold has fallen about 36% from its January high of $5,590 to $3,560. It dropped 8%–9% for the week, its worst showing in nearly eight months, and hit its lowest level since September 2025. The 24-hour low was $3,514–$3,520, and the high was $3,740–$3,750.
Are you getting that itch? “It’s fallen so much already—it has to bounce, right?”
First: The Fed isn’t just hawkish; it’s dead set on killing gold.
The October FOMC minutes showed that almost all officials thought further rate hikes were needed. Several Fed officials publicly stressed that inflation remains high and even mentioned the possibility of a half-point rate hike. CME FedWatch puts the odds of a 25 bp hike at the December 9 meeting at around 93%–97%.
Gold pays no interest, while the interest you can earn by keeping money in the bank or buying Treasuries keeps rising.
The dollar index is near a 19-month high, and the 10-year Treasury yield is holding around 5.1%. A strong dollar plus high real interest rates is gold’s biggest enemy.
Second: Central-bank gold buying is a long-term story; it can’t save you in the short term.
Central banks bought around 321 tonnes of gold in Q3, up 42% year over year. That’s a source of medium- to long-term support. But ETF funds have continued to flow out. Geopolitical and fiscal risks are still there, too. But in the short term, pricing power lies with the Fed, the dollar, and yields.
Don’t use “central banks are buying” to reassure yourself.
Central banks are buying based on a five- or ten-year thesis; you’re carrying leverage over five or ten days.
A long-term story can’t save a short-term position.
Third: The technicals are telling you that a bounce is your chance to get out alive.
The daily, 4H, and 1H charts all show a clear downtrend structure: lower highs and lower lows. Price is trading below the descending channel, with several large bearish candles breaking below $3,800 and $3,700 before the decline accelerated.
The 1H RSI is often below 20, signaling extreme oversold conditions.
The MACD histogram is becoming more negative.
The SMA20 is acting as resistance above $3,640–$3,650.
ATR shows hourly volatility is still $20–$30.
Could oversold conditions trigger a bounce? Yes.
But until the macro picture turns, a bounce is more likely to be a rally to sell into than a reversal.
Support: $3,515–$3,520 (recent low) → $3,480–$3,500 → $3,420
Resistance: $3,590–$3,600 → $3,640–$3,650 → $3,680–$3,700 → $3,750–$3,800
A decisive daily close below $3,515 would open up more downside.