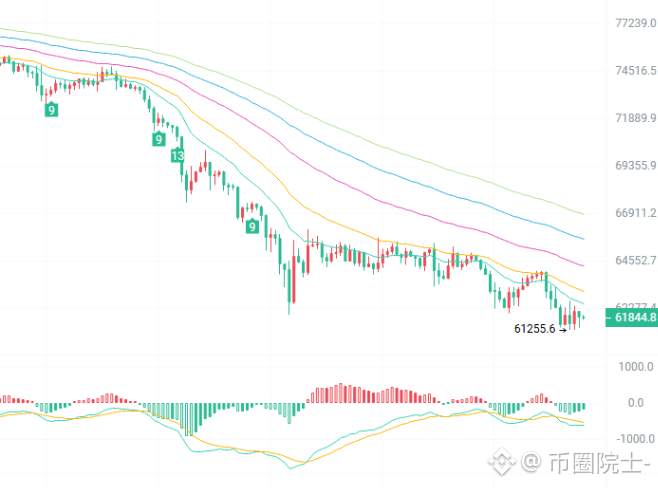
$BTC Current price: 61840. This drop has kept many people awake at night: those who bought the dip are stuck, while those chasing shorts fear a rebound. The market is in a real bind. A big drop doesn’t mean a rise is due; the market only cares where the money is flowing. Until a clear signal emerges, any talk of a bottom is wishful thinking.
The bearish trend is clear on the 2-hour chart: moving averages are stacked overhead, price is languishing below them, MACD remains below the zero line, and price is moving along the lower Bollinger Band—all classic signs of weakness. Strong resistance sits at 62400–62800. If 61250 breaks, there could be even lower levels ahead. Any rebound may just be a pause in the downtrend, not a reversal.
On the 15-minute chart, this is simply a breather after a steep drop. The bounce back to 61840 looks like a rebound, but it’s actually very weak. The low-level MACD golden cross has produced only a small red histogram, while the longer-term moving averages continue to weigh on price. Selling pressure is layered between 62200 and 62400, and each push higher gets knocked back.
Strategy:
Don’t fight the trend. If a rebound stalls at resistance, consider a small short position, with a stop-loss above 62800.
If you want to trade a rebound, watch only for signs of support holding at 61250, with a stop-loss below 61000.
If the previous low breaks, exit immediately. Don’t chase shorts at the lows or hold on stubbornly. Reduce position size; if you don’t understand the market, sit and wait.
(For technical discussion only; this does not constitute investment advice.)
#BTC
The bearish trend is clear on the 2-hour chart: moving averages are stacked overhead, price is languishing below them, MACD remains below the zero line, and price is moving along the lower Bollinger Band—all classic signs of weakness. Strong resistance sits at 62400–62800. If 61250 breaks, there could be even lower levels ahead. Any rebound may just be a pause in the downtrend, not a reversal.
On the 15-minute chart, this is simply a breather after a steep drop. The bounce back to 61840 looks like a rebound, but it’s actually very weak. The low-level MACD golden cross has produced only a small red histogram, while the longer-term moving averages continue to weigh on price. Selling pressure is layered between 62200 and 62400, and each push higher gets knocked back.
Strategy:
Don’t fight the trend. If a rebound stalls at resistance, consider a small short position, with a stop-loss above 62800.
If you want to trade a rebound, watch only for signs of support holding at 61250, with a stop-loss below 61000.
If the previous low breaks, exit immediately. Don’t chase shorts at the lows or hold on stubbornly. Reduce position size; if you don’t understand the market, sit and wait.
(For technical discussion only; this does not constitute investment advice.)
#BTC