Zoom out to the weekly chart, and a lot of stories stop holding up.
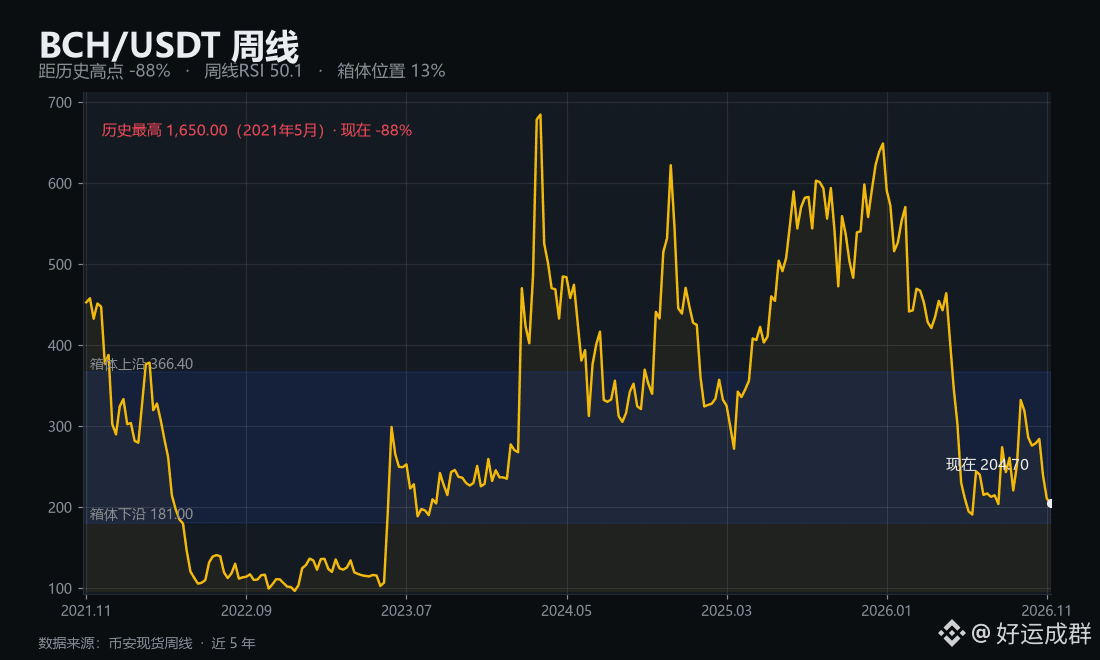
$BCH is currently at 204.70, 88% below the all-time high of 1,650.00 in May 2021. It’s been in this hole for 288 weeks.
It has closed below the 50-week moving average for 39 consecutive weeks, and it has never really recovered since that last bull run.
It’s now near the lower end of the 181.00–366.40 range of the past 24 weeks, at around the 13% mark. The weekly RSI is 50.1.
181.00 is the dividing line. A decisive break below it puts the next level at 166.52. And it’s not just this coin— the entire established-coin sector needs to stay on guard.
Remember this: a big drop doesn’t mean it’s cheap. It just means it’s dropped a lot.
What do you think of $BCH at this level?
#BCH #山寨币 #Recap
$BCH is currently at 204.70, 88% below the all-time high of 1,650.00 in May 2021. It’s been in this hole for 288 weeks.
It has closed below the 50-week moving average for 39 consecutive weeks, and it has never really recovered since that last bull run.
It’s now near the lower end of the 181.00–366.40 range of the past 24 weeks, at around the 13% mark. The weekly RSI is 50.1.
181.00 is the dividing line. A decisive break below it puts the next level at 166.52. And it’s not just this coin— the entire established-coin sector needs to stay on guard.
Remember this: a big drop doesn’t mean it’s cheap. It just means it’s dropped a lot.
What do you think of $BCH at this level?
#BCH #山寨币 #Recap