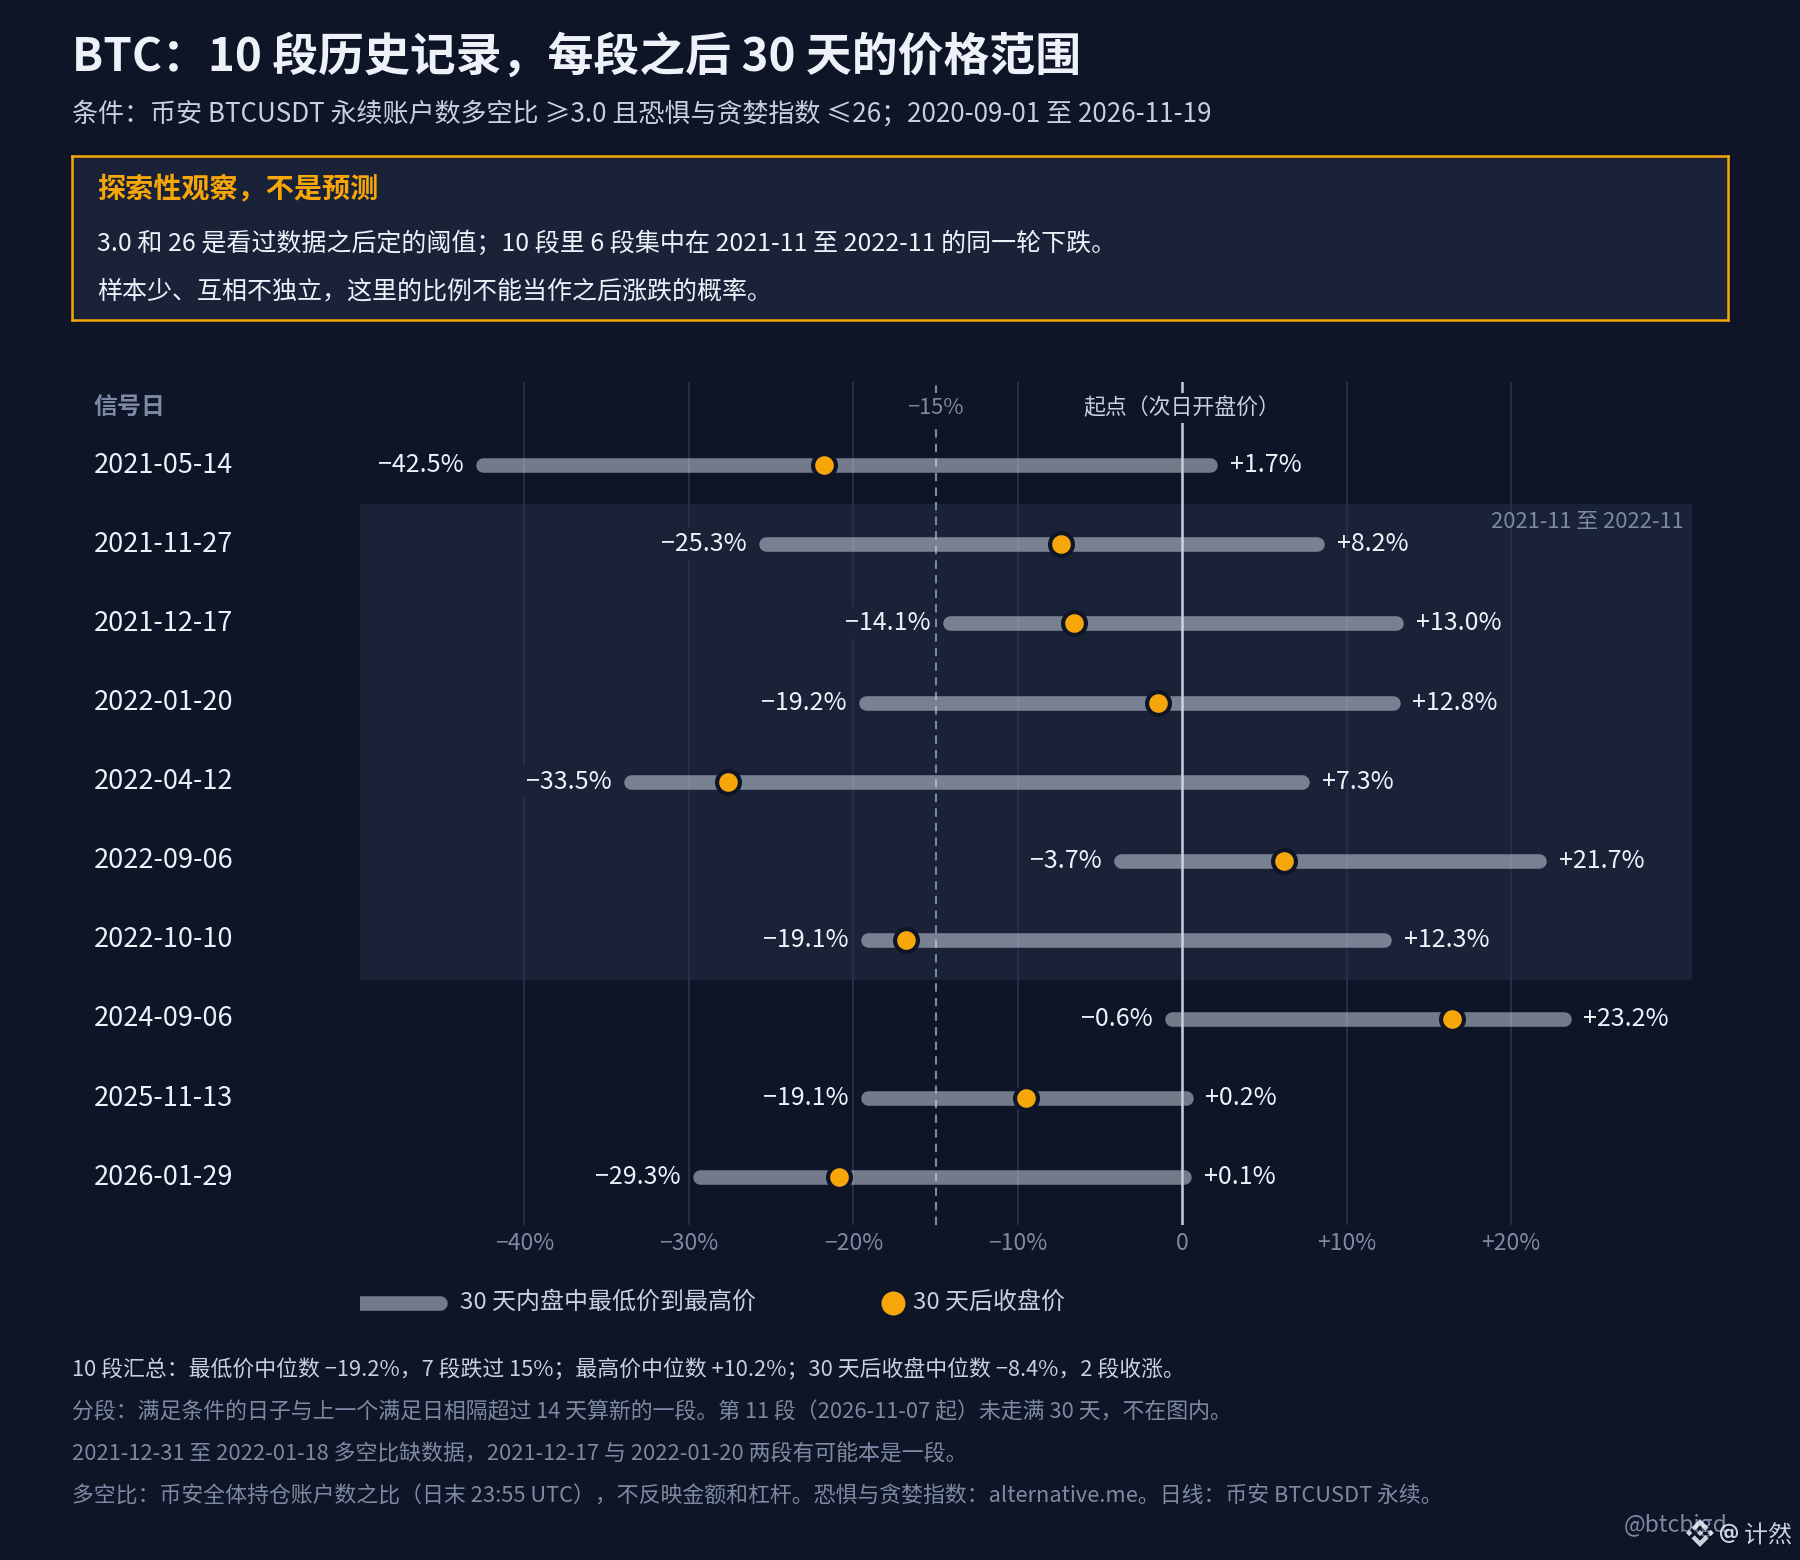
$BTC Long/short ratio 3.43, Fear & Greed Index 10: 10 similar combinations have appeared historically, and 7 were followed by a drop of more than 15% within 30 days
Before the November 19 UTC close, the number of Binance BTC perpetual long accounts was 3.43 times the number of short accounts, and the Fear & Greed Index that day was 10. Looking for days since September 2020 when the “long/short ratio ≥3.0 and Fear & Greed Index ≤26,” there are 10 episodes with a full 30 days of follow-up data.
【First, the limitations】
- This is an exploratory observation. The thresholds of 3.0 and 26 were chosen after looking at the data, not set in advance and then tested.
- Using nearby thresholds (long/short ratio from 2.8 to 3.4, Fear & Greed Index from 20 to 40), 15 of the 16 combinations had a median between −16.6% and −31.4%; the remaining combination had only 1 episode, at −12.6%. All these results come from the same historical period, so they are not independent validation.
- Six of the 10 episodes were concentrated in the same downturn from November 2021 to November 2022, and are not independent of one another. Among daily starting points in that same period, 57% saw a drop of more than 15% within the following 30 days; it is impossible to distinguish how much was due to the combination itself versus the market downturn.
- The sample is small, the thresholds were selected after the fact, and the observations are correlated. Historical proportions should not be treated as the probability of a future decline.
- The long/short ratio counts accounts, not the amount of funds or leverage.
- Long/short ratio data is missing from December 31, 2021, to January 18, 2022, so the two episodes on either side may actually have been one.
【Records for the 10 episodes】
Starting from the opening price on the day after each episode’s signal date, the next 30 daily candles were observed:
- The median decline from the starting point to the intraday low within 30 days was −19.2%; 7 episodes fell by more than 15%.
- The median rise from the starting point to the intraday high within 30 days was +10.2%.
- The median closing price 30 days later was −8.4% relative to the starting point; 2 episodes closed higher, in September 2022 and September 2024.
- In 8 episodes, the high within 30 days came before the low.
- For comparison: treating every qualifying date in the same period as a starting point gives 2,241 points in total; the 30-day windows overlap, so this is only a reference. 28% fell by more than 15% within 30 days, and 55% closed higher after 30 days.
“30-day low” refers to the intraday price, not the closing price, and is not a return that could have been earned by shorting.
【The 11th episode currently underway】
The signal was triggered on November 7. Starting from the November 8 opening price of $75,836, this episode is not included in the statistics above. As of November 19, the low over these 12 days was $61,375 (−19.1%). This drop has already happened; historical records cannot tell us which way the price will go next.
In times of extreme fear, long accounts actually outnumber short accounts by more than 3 to 1!!! Are any of these long positions your dip-buying orders too? 🤔
#BTC #Fear & Greed Index
Before the November 19 UTC close, the number of Binance BTC perpetual long accounts was 3.43 times the number of short accounts, and the Fear & Greed Index that day was 10. Looking for days since September 2020 when the “long/short ratio ≥3.0 and Fear & Greed Index ≤26,” there are 10 episodes with a full 30 days of follow-up data.
【First, the limitations】
- This is an exploratory observation. The thresholds of 3.0 and 26 were chosen after looking at the data, not set in advance and then tested.
- Using nearby thresholds (long/short ratio from 2.8 to 3.4, Fear & Greed Index from 20 to 40), 15 of the 16 combinations had a median between −16.6% and −31.4%; the remaining combination had only 1 episode, at −12.6%. All these results come from the same historical period, so they are not independent validation.
- Six of the 10 episodes were concentrated in the same downturn from November 2021 to November 2022, and are not independent of one another. Among daily starting points in that same period, 57% saw a drop of more than 15% within the following 30 days; it is impossible to distinguish how much was due to the combination itself versus the market downturn.
- The sample is small, the thresholds were selected after the fact, and the observations are correlated. Historical proportions should not be treated as the probability of a future decline.
- The long/short ratio counts accounts, not the amount of funds or leverage.
- Long/short ratio data is missing from December 31, 2021, to January 18, 2022, so the two episodes on either side may actually have been one.
【Records for the 10 episodes】
Starting from the opening price on the day after each episode’s signal date, the next 30 daily candles were observed:
- The median decline from the starting point to the intraday low within 30 days was −19.2%; 7 episodes fell by more than 15%.
- The median rise from the starting point to the intraday high within 30 days was +10.2%.
- The median closing price 30 days later was −8.4% relative to the starting point; 2 episodes closed higher, in September 2022 and September 2024.
- In 8 episodes, the high within 30 days came before the low.
- For comparison: treating every qualifying date in the same period as a starting point gives 2,241 points in total; the 30-day windows overlap, so this is only a reference. 28% fell by more than 15% within 30 days, and 55% closed higher after 30 days.
“30-day low” refers to the intraday price, not the closing price, and is not a return that could have been earned by shorting.
【The 11th episode currently underway】
The signal was triggered on November 7. Starting from the November 8 opening price of $75,836, this episode is not included in the statistics above. As of November 19, the low over these 12 days was $61,375 (−19.1%). This drop has already happened; historical records cannot tell us which way the price will go next.
In times of extreme fear, long accounts actually outnumber short accounts by more than 3 to 1!!! Are any of these long positions your dip-buying orders too? 🤔
#BTC #Fear & Greed Index